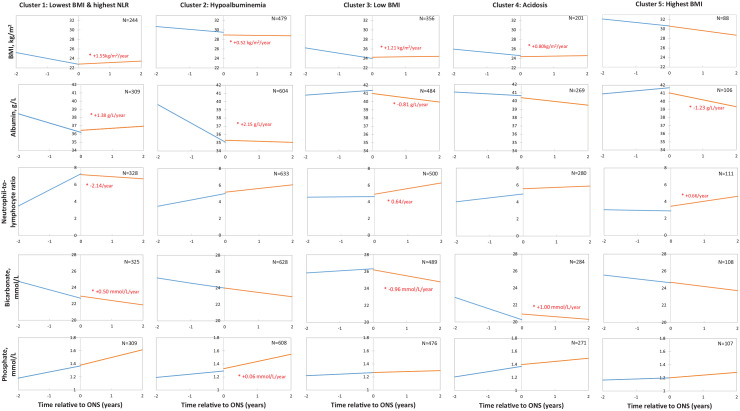
Figure 2.
Nutritional trajectories, by cluster, for body mass index, serum albumin, neutrophil-to-lymphocyte ratio, serum bicarbonate, serum phosphate before and after the first oral nutritional supplement prescription among patients with nondialysis chronic kidney disease.
Note. Statistically significant changes in post-ONS versus pre-ONS slopes (P < .05) are marked by an asterisk (*). Time 0 refers to time of the first ONS prescription. Linear mixed effect models adjusted for sex, age, eGFR, urine albumin-creatinine ratio, hypertension, cardiovascular disease, diabetes, health region, and calendar year of the first ONS prescription. Graph shown for reference patient with the following characteristics: 60 years old; male sex; no history of cardiovascular disease, diabetes, or hypertension; urine albumin-to-creatinine ratio: 3.0 mg/mmol; eGFR: 60 ml/min/1.73m2; Island Health Authority; initiated ONS prescription in 2015. BMI = body mass index; NLR = neutrophil-to-lymphocyte ratio; ONS = oral nutritional supplement; eGFR = estimated glomerular filtration rate.

