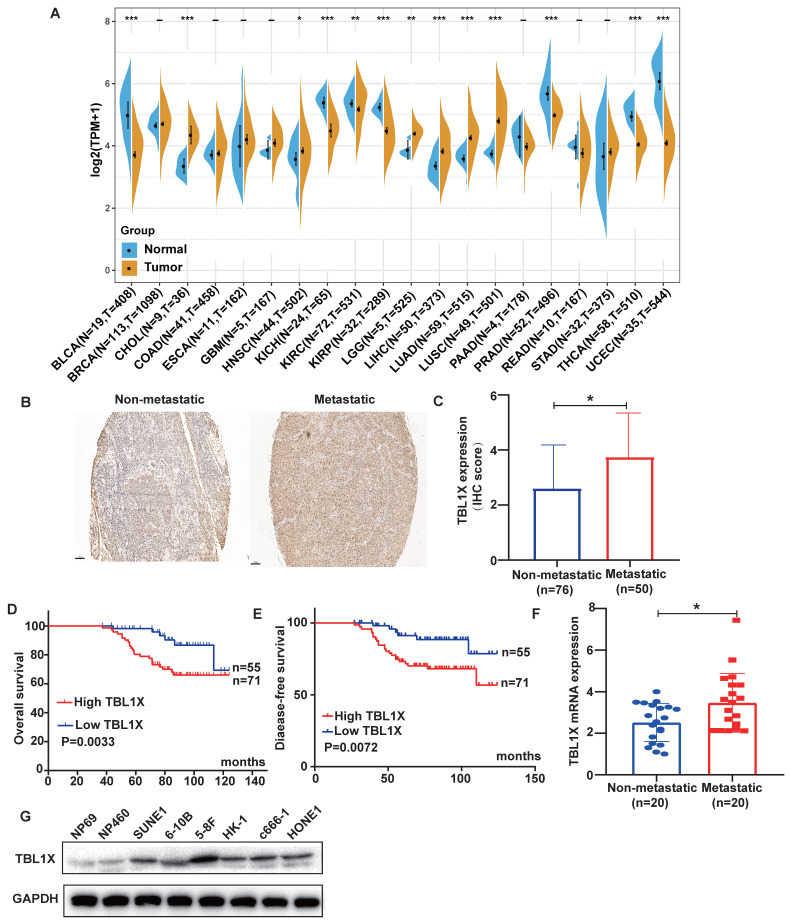
Figure 1.
The expression of TBL1X in NPC and its correlation with patient survival. (A) TBL1X expression in different cancers. (B) Representative images of IHC staining of TBL1X in non-metastatic and metastatic NPC tissues (scale bar=100 μm). (C) The IHC scores of TBL1X expression. (D, E) The OS (D) and DFS (E) curves of NPC patients were associated with TBL1X expression. (F) Analysis of TBL1X mRNA expression in NPC tissues. (G) TBL1X protein expression in NPC cells and normal NPE cells. The results are shown as means±SD. *P <0.05, **P <0.01, ***P<0.001.

