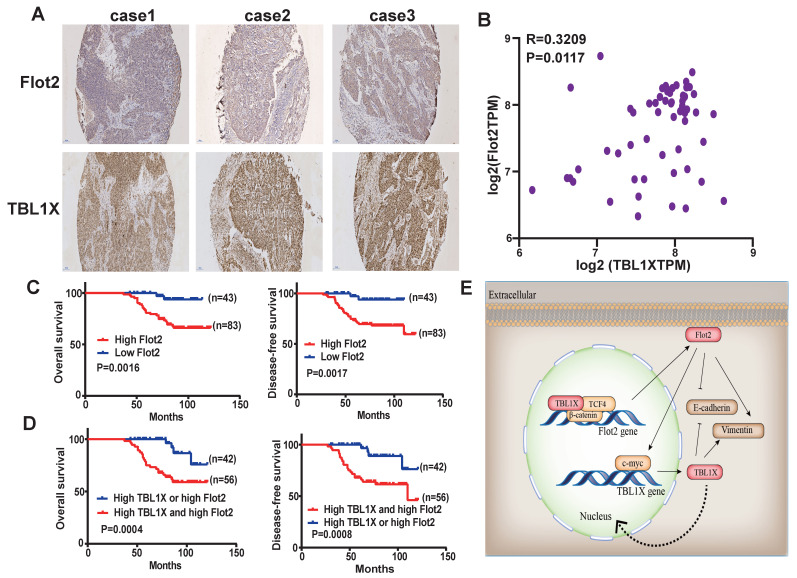
Figure 8.
TBL1X expression is positively associated with Flot2 level in NPC. (A) Representative IHC images of TBL1X and Flot2 expression in NPC samples (Scale bar=100 μm). (B) Positive correlation between TBL1X and Flot2 expression in NPC tissues of GEO batch. (C) Kaplan Meier survival analysis for NPC patients based on expression levels of Flot2. (D) Kaplan Meier survival analysis for NPC patients based on expression levels of both TBL1X and Flot2. (E) Model for tumor promotion role of TBL1X-Flot2 feedback axis and the underlying mechanisms in NPC.

