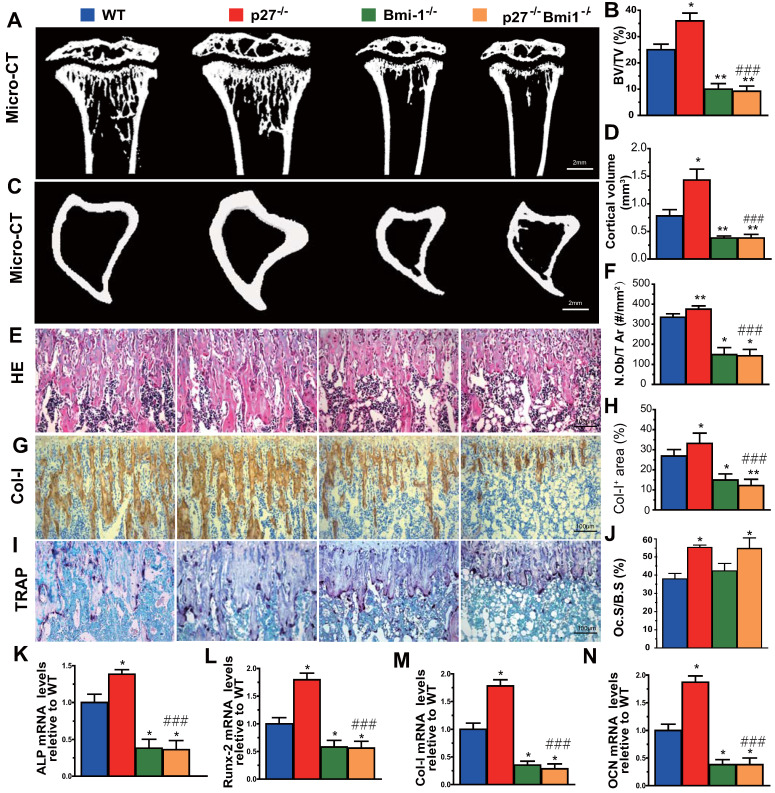
Figure 6.
Deletion of Bmi1 blocks p27 deficiency-induced osteoblastic bone formation in vivo. (A, C) Representative micro-CT scans of 3-dimensional longitudinal reconstructions of proximal ends of tibiae and midshaft diaphysis from 4-week-old WT, p27-/-, Bmi1-/- and p27-/-Bmi1-/- mice. (B) Trabecular bone volume relative to tissue volume (BV/TV, %). (D) Cortical bone volume (mm3). Representative micrographs of paraffin-embedded sections of tibias from 4-week-old WT, p27-/-, Bmi1-/- and p27-/-Bmi1-/- mice: (E) staining with H&E and (F) the number of osteoblasts per mm2 tissue area (N.Ob/T.Ar, #/mm2), (G) immunohistochemical staining for type I collagen (Col-I) and (H) Col-I-positive areas as a percent of the tissue area (%), (I) histochemical staining for TRAP and (J) osteoclast surface/bone surface (Oc.S/BS, %). Real-time RT-PCR analyses of long bone extracts for the expression of (K) ALP, (L) Runx2, (M) Col-I and (N) OCN. Messenger RNA expression assessed by RT-PCR was calculated as a ratio relative to the GAPDH mRNA level and expressed relative to WT control. Values are mean ± s. e. m. of 5 determinations per group. *: P<0.05; **: P<0.01 compared with WT mice. ###: P<0.001 compared with p27-/- mice.

