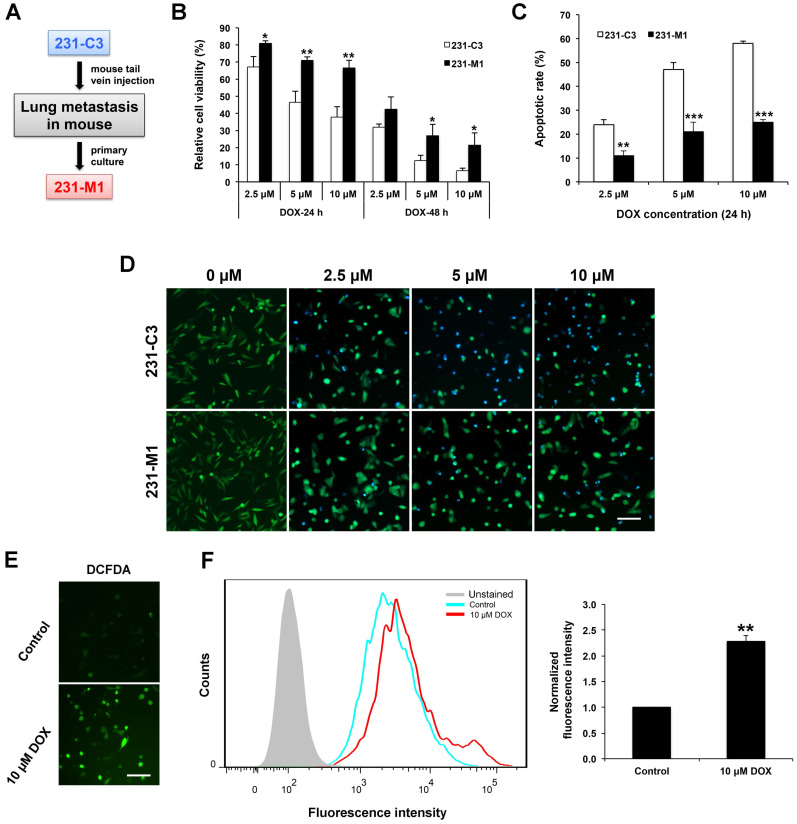
Figure 1.
Metastatic 231-M1 cells develop resistance to DOX treatment that induces high level of intracellular oxidative stress. (A) Schematic diagram of 231-M1 cells generation. 231-C3 cells were injected into tail vein of a nude mouse. After 45 days, a micrometastasis was formed in the lung of the mouse and dissected for primary culture and a novel metastatic TNBC cell line, 231-M1 was generated. (B) 231-M1 cells displayed significantly higher cell viability than 231-C3 cells upon DOX treatment. The cells were treated with DOX at 2.5 µM, 5 µM, and 10 µM respectively for 24 h, 48 h and subjected to MTT assay. The results were normalized to the control group without drug treatment. (C-D) 231-M1 cells exhibited significantly lower apoptotic rate than 231-C3 cells upon DOX treatment. The cells were treated with DOX at 2.5 µM, 5 µM, and 10 µM respectively for 24 h with representative FRET images were shown in (D). Apoptotic rate of these sensor cells was quantified by FRET imaging, as healthy cells exhibited green color while apoptotic cells turned to blue color. Scale bar, 100 µm. (E) MDA-MB-231 cells were treated with or without 10 µM (Control) of DOX for 24 h and stained with a fluorescent dye (CM-H2DCFDA) for detecting ROS. The representative fluorescent images show that DOX treatment produced a high level of ROS in MDA-MB-231 cells. Scale bar, 100 µm. (F) The left panel shows the flow cytometry analysis of these stained cells and cells without staining (Unstained). Right panel shows the quantified fluorescence intensity from the flow cytometry analysis. The results were normalized to DCFDA-stained control group without DOX treatment.

