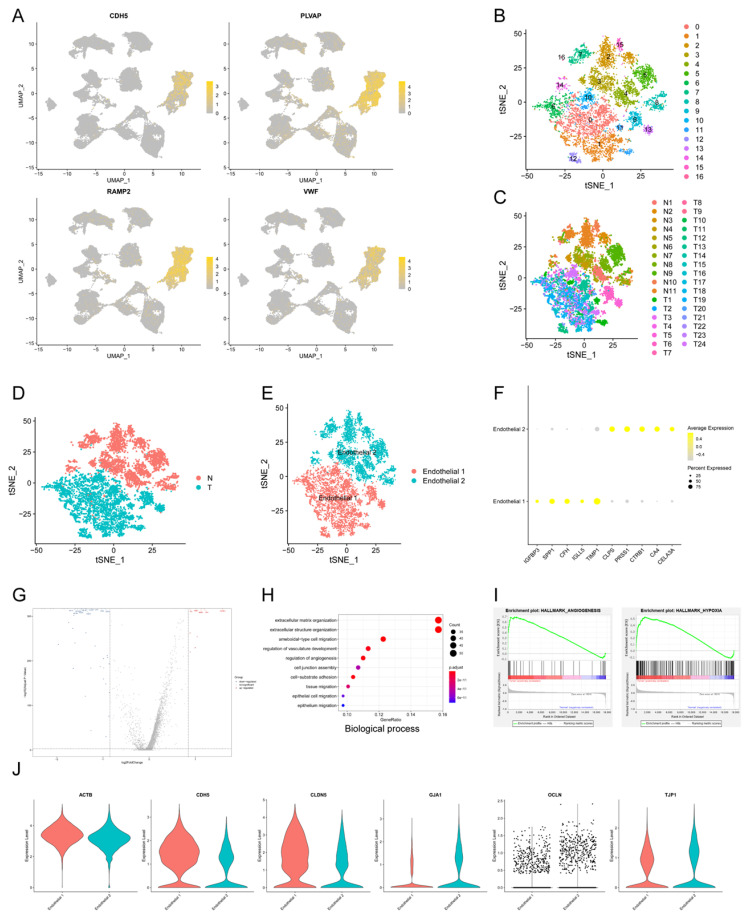
Fig 2.
The transcriptional profile characteristics of endothelial cells in PDAC. (A) u-MAP plot showing the expression of signature genes of endothelial cells across cell clusters. The intensity of color represented expression level. (B-E) t-SNE plot showing original clusters (B), clusters from different specimens (C), clusters from PDAC or normal pancreatic specimens (D), named cell identifications (E). (F) Dot plot showing top 5 marker genes of two endothelial cell subpopulations. (G) Total differential expression genes between Endothelial 1 and Endothelial 2 were exhibited by volcano plot, red and blue dots represented the upregulated and downregulated genes respectively. (H) Gene ontology analysis showing biological process terms of upregulated genes in Endothelial 1, colorful dots represented the level of statistical significance. (I) Enrichment results of differential expression genes according to h.all.v7.2.symbols by GSEA analysis. (J) Violin plot showing the normalized expression level of cell junction proteins between Endothelial 1 and Endothelial 2.

