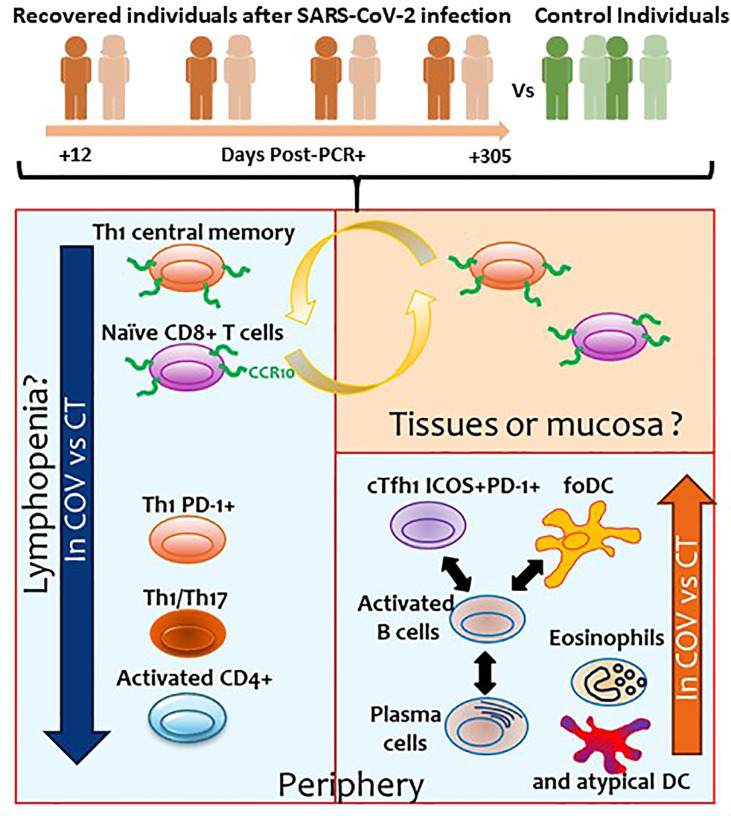
Figure 6.
Summary of the results obtained in the present study. Orange and green individuals represent the recovered individuals after SARS-CoV-2 infection and controls, respectively. Numbers represents the days post-PCR+ when the samples of the former COVID-19 individuals were analysed. Blue squares represent the cellular subsets with altered levels observed in the periphery. Orange square represents the cellular subsets that could be potentially found in tissues or mucosa.

