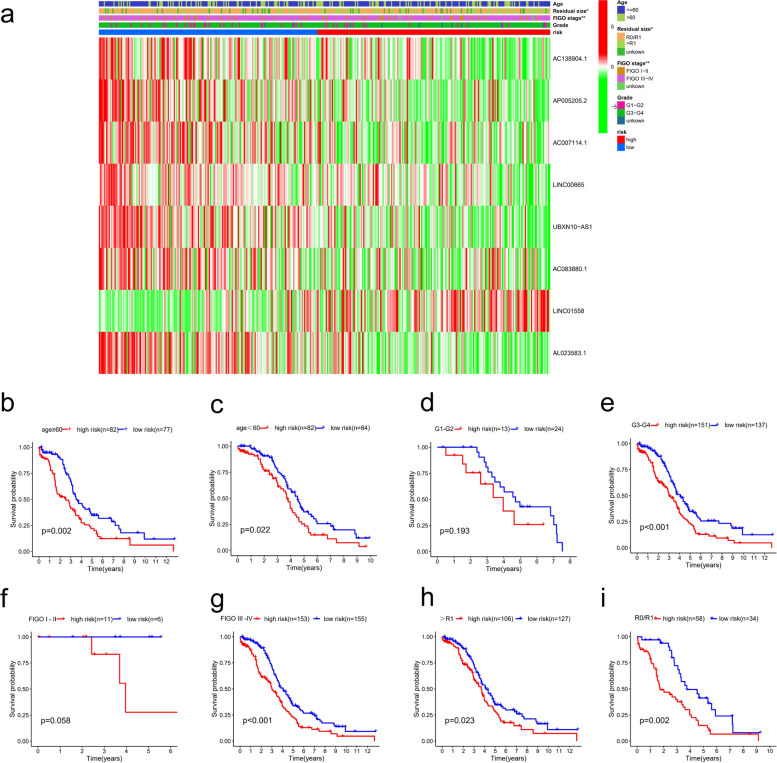
Fig. 6.
Correlation of the risk score of with clinicopathological features. a 8 FIRLs expression in all patients and correlation between FIRLs signature and clinicopathological features; b, c The survival differences between different risk groups stratified by age; d, e The survival differences between different risk groups stratified by grade; f, g The survival differences between different risk groups stratified by FIGO stage; h, i The survival differences between different risk groups stratified by residual tumor size; *P < 0.05; **P < 0.01; ***P < 0.001

