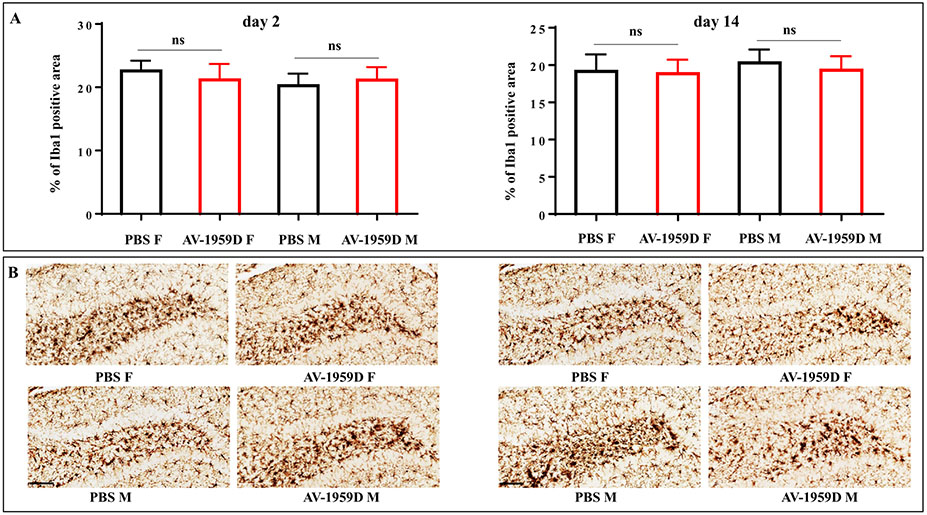
Fig. 9.
No increase in microglia activation was observed in AV-1959D/EP vaccinated Tg-SwDI mice compared with control animals 2 and 14 days after the last immunization. (A) Bars represent the average percent of Iba-1 positive area ± SEM. (B) Photomicrographs of representative images show reactive microglia in the hilar region of dentate gyrus vs. hyper-ramified microglial profiles in the adjacent layers in the brains of immunized (n = 8/gender/time point) and control (n = 7/gender/time point) female (F) and male (M) mice. Scale bars = 100 μm.

