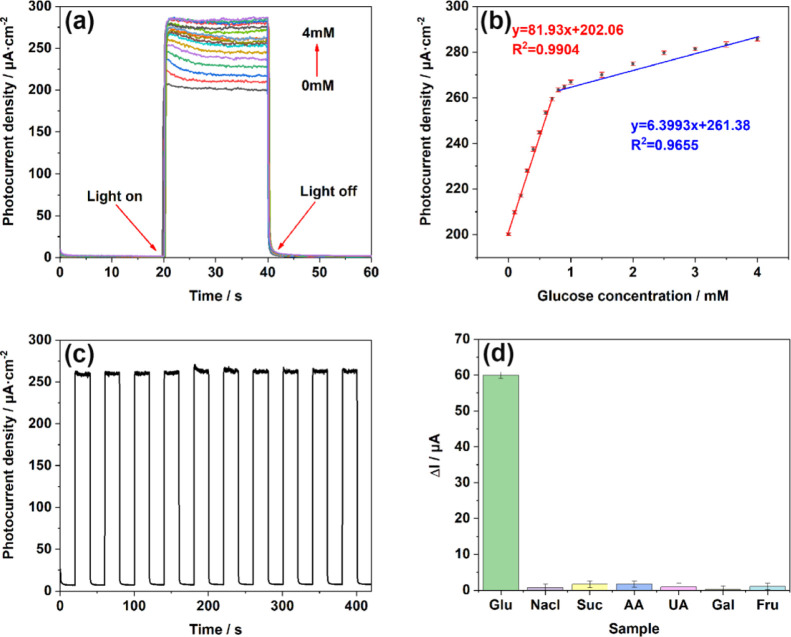
Figure 6.
(a) i–t responses of TiO2NTs/Au/Pt toward Glu at concentrations of 0–4 mM in the supporting electrolyte of 0.1 M PBS (pH = 7.4); (b) linear calibration curve (glucose concentration vs photocurrent density); (c) stability after addition of 1 mM glucose under light conditions; and (d) anti-interference performance test performed in 0.1 M PBS (pH = 7.4) at concentrations of 0.1 mM chloride (NaCl), sucrose (Suc), ascorbic acid (AA), uric acid (UA), galactose (Gal), and fructose (Fru).

