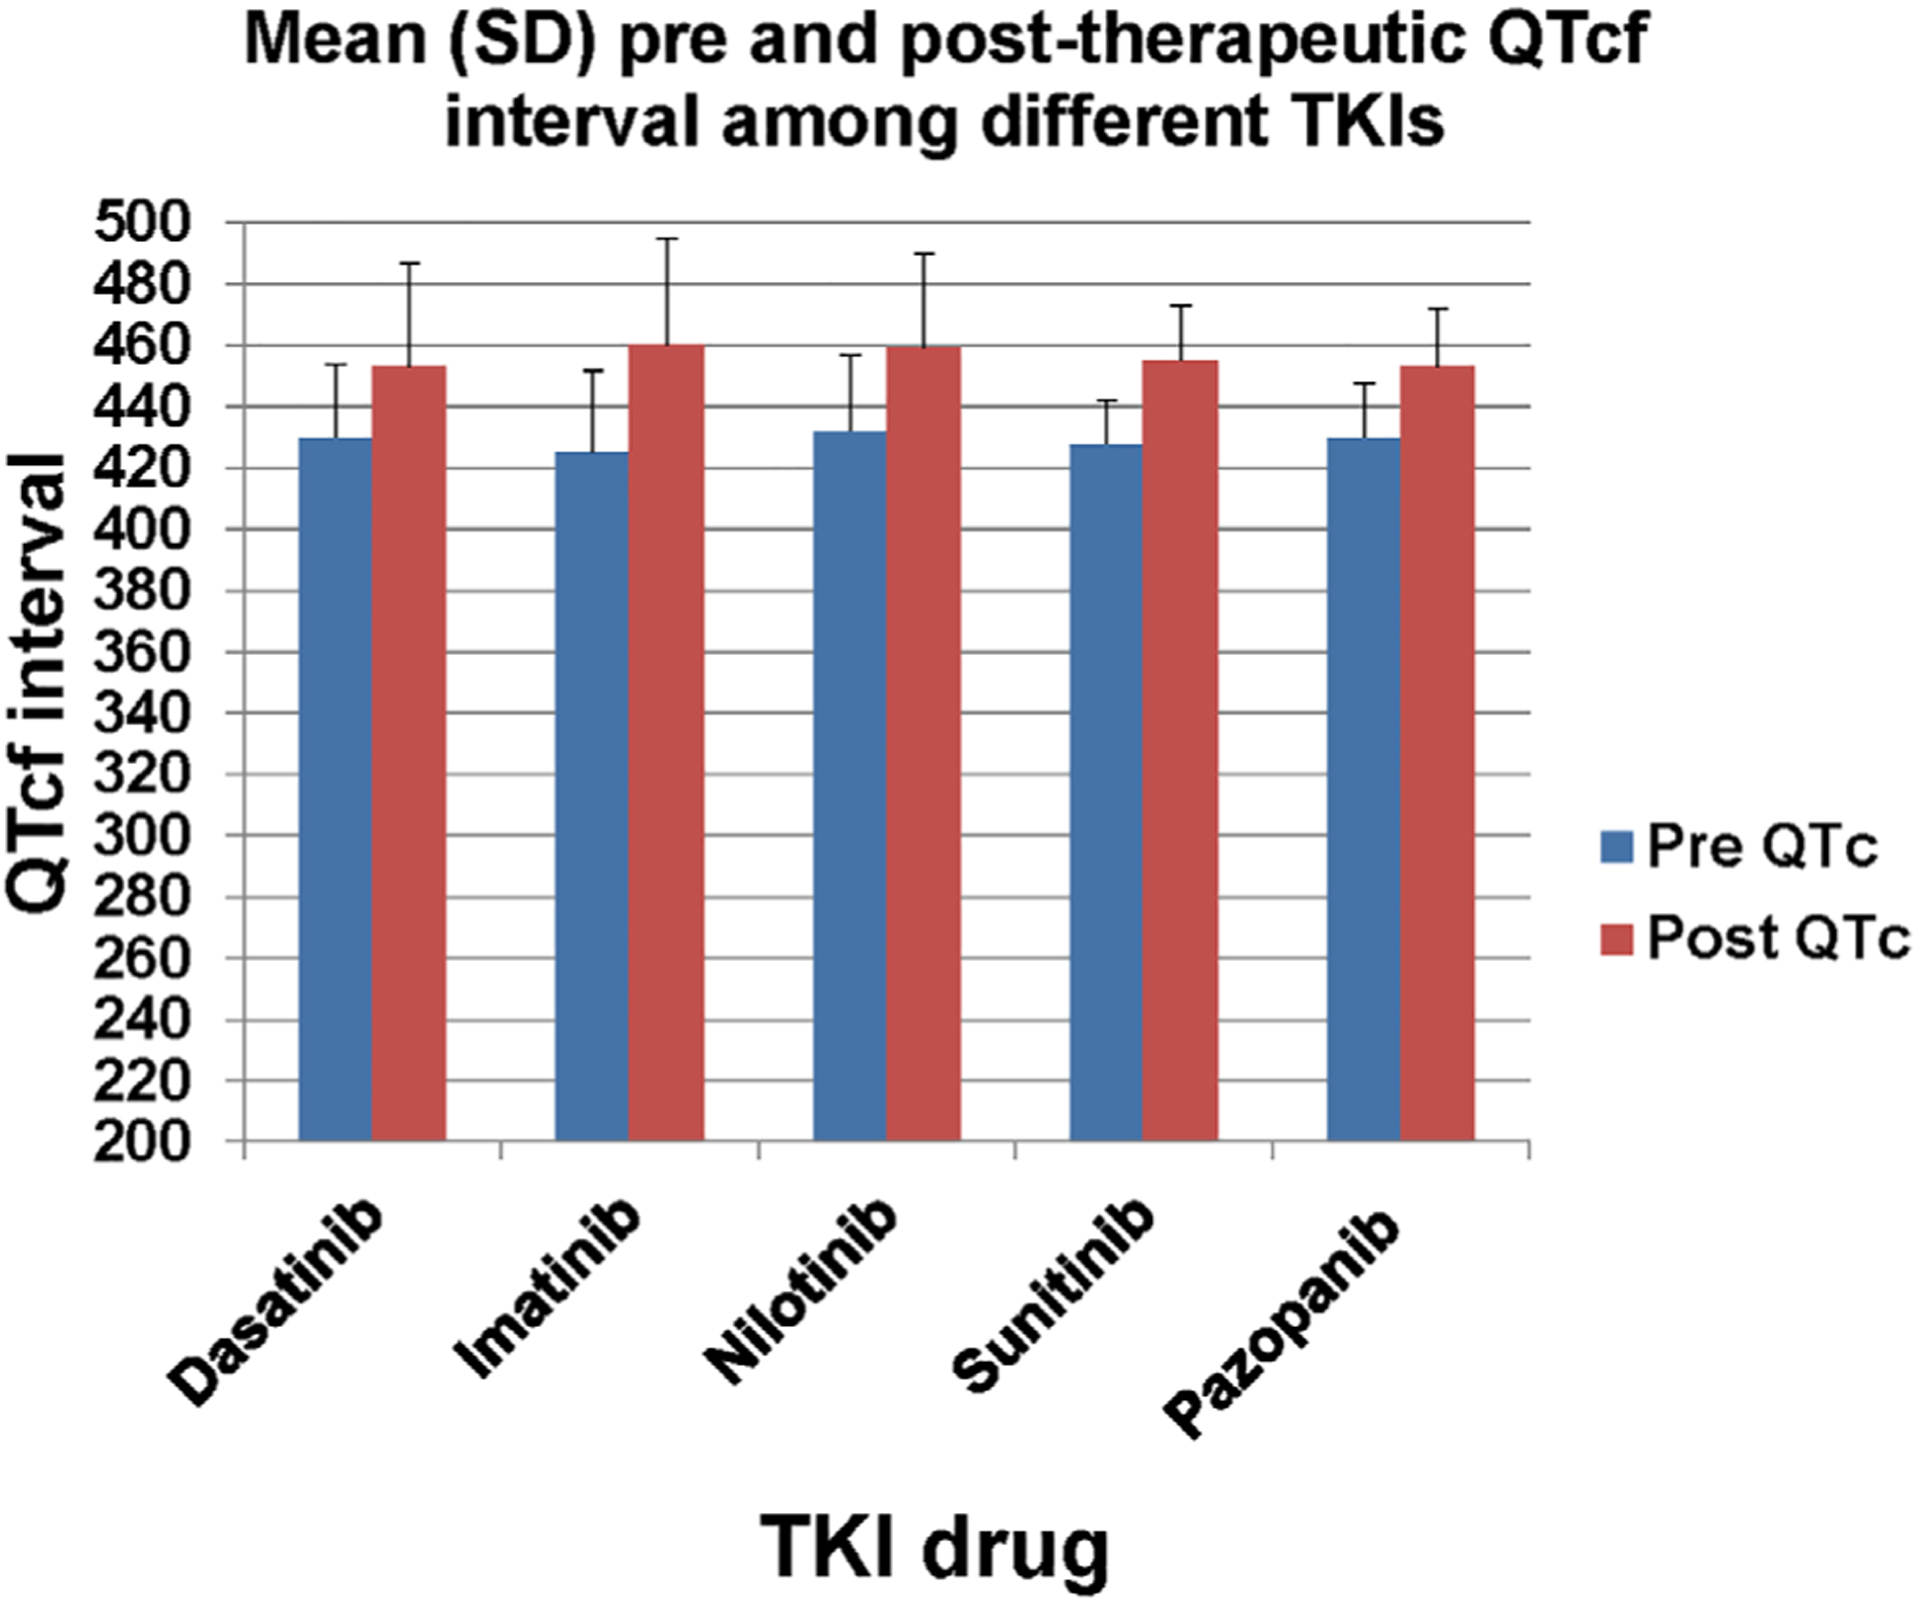
FIGURE 1.

Mean (SD) of pretherapeutic and posttherapeutic QTcf interval among different TKIs. Significant differences were found in comparisons between pre-QTcf vs post-QTcf values for dasatinib (P value = .001), imatinib (P value = .001), nilotinib (P value = .001), sunitinib (P value = .001) and pazopanib (P value < .001)
