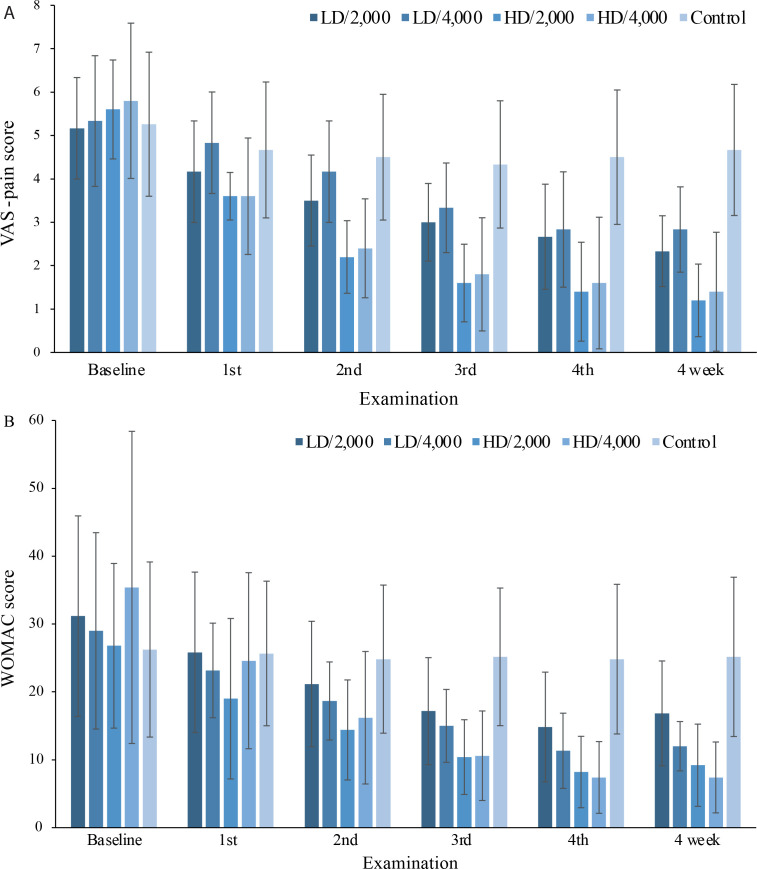
Fig. 2.
Changes from baseline to the 4-week follow-up in the visual analogue scale (VAS)-pain scores and Western Ontario and McMaster Universities Osteoarthritis Index (WOMAC) scores across all groups (mean (standard deviation (SD)). (A) The mean VAS-pain score of all groups at baseline, after the 1st, 2nd, 3rd, and 4th sessions of treatment, and at the 4-week followup. (B) Variations in the mean WOMAC score across all groups. Group: LD/2,000, n = 19; LD/4,000, n = 19; HD/2,000, n = 19; HD/4,000, n = 18; Control group, n = 14. VAS: visual analogue scale; HD: higher density; LD: lower density; 4,000: 4,000 impulses; 2,000: 2,000 impulses.

