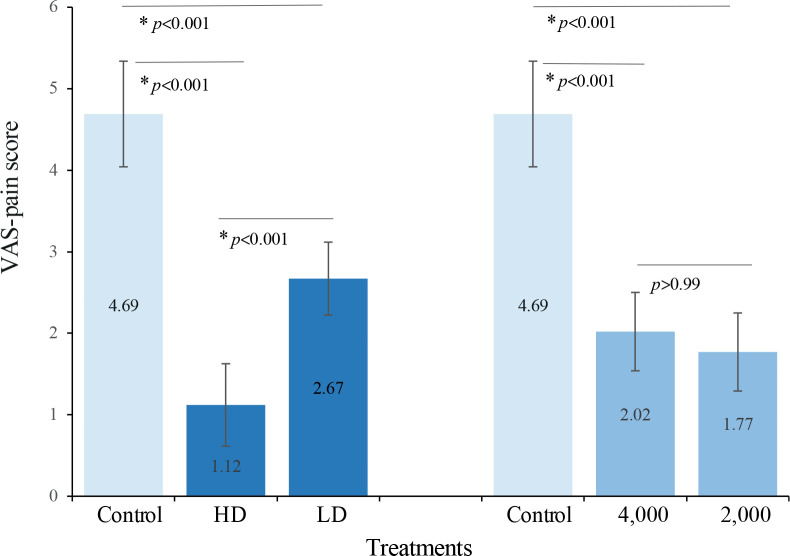
Fig. 3.
Comparisons of the visual analogue scale (VAS)-pain scores among treatments at the 4-week follow-up. Values are estimated marginal means (95% confidence interval; 95% CI) from 2-way repeated measures analysis of variance (ANOVA). *p < 0.05/3, post hoc Bonferroni-adjusted tests for multiple comparisons (k=3). HD: higher density; LD: lower density; 4,000: 4,000 impulses; 2,000: 2,000 impulses.

