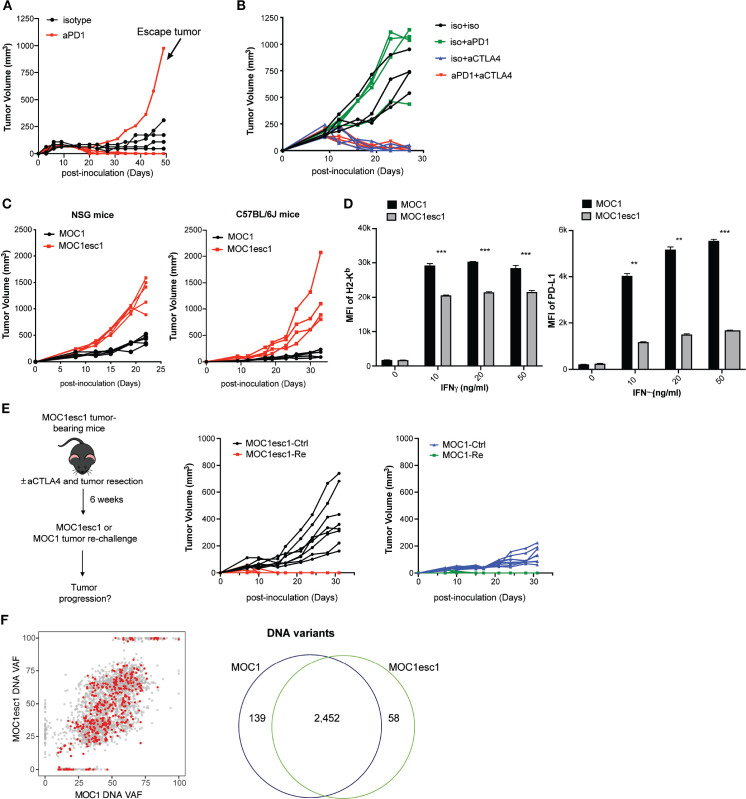
Figure 1.
A carcinogen-induced HNSCC model, MOC1, displays adaptive resistance to anti-PD1. (A) MOC1 anti-PD1 sensitivity and escape tumor growth. MOC1 bearing C57BL/6 mice were treated with anti-PD1 or isotype control on days 3, 6 and 9 (n=4–5 each group). This experiment was repeated two times. The indicated escape tumor was harvested and cultured to generate polyclonal MOC1esc1. (B) C57BL/6 mice bearing MOC1esc1 tumors were resistant to anti-PD1, but sensitive to anti-CTLA4 therapy (n=4 per group). (C) Growth curves of MOC1 and MOC1esc1 tumors in immunodeficient NSG or immunocompetent C57BL/6 mice (n=4 per group). (D) Cell surface protein levels of H2-Kb and PD-L1 on MOC1 and MOC1esc1 treated with indicated IFNγ concentrations for 48 hours were measured by flow cytometry (**p<0.01, ***p<0.001). Significance was calculated by unpaired Student’s t-test. Data are shown as Mean±SD, n=3 per group. (E) Tumor rechallenge studies. C57BL/6 mice implanted with MOC1esc1 tumors were cured of tumor with anti-CTLA4 (50%) and surgical resection as needed (50%) of any residual or growing tumors. After 6 weeks of rest, tumor free mice were rechallenged with parental MOC1 or MOC1esc1 lines and monitored for tumor growth. Age-matched naive C57BL/6 mice were implanted with MOC1 or MOC1esc1 as control groups. n=6–8 per group. (F) Clonality plots comparing variant allele frequency (VAF) of single nucleotide variants (SNVs) in MOC1 and MOC1esc1 lines, with red dots representing predicted neoantigens. Venn diagram showing the numbers of SNVs in MOC1 and MOC1esc1 lines. HNSCC, head and neck squamous cell carcinoma; MOC1, murine oral carcinoma.

