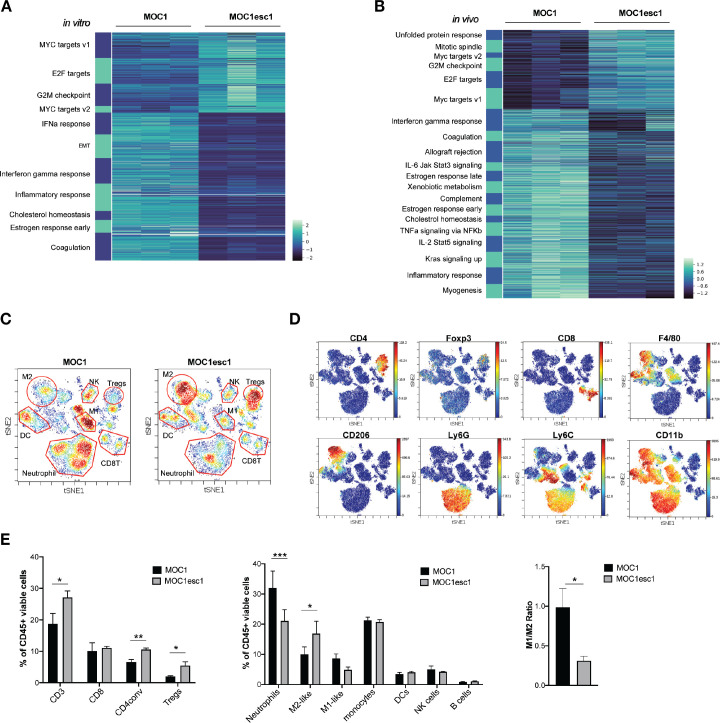
Figure 2.
MOC1esc1 tumors are highly infiltrated by Tregs and M2-like TAMs. (A) In vitro RNA-seq analysis revealed distinct transcriptomic changes between MOC1 and MOC1esc1 lines. Enriched hallmark gene sets are shown by heatmap of gene mRNA expression levels. All gene sets were enriched with FDR<0.001. (B) RNA-seq analysis of MOC1 and MOC1esc1 bulk tumor samples from day 14 after implantation (N=3 per group). Hallmark gene sets enriched for upregulated and downregulated mRNAs were visualized using mRNA expression value heatmaps. All gene sets were enriched with FDR<0.001 between MOC1 and MOC1esc1 tumors ranked by normalized enrichment score. (C) Immune profiling of MOC1 and MOC1esc1 TME in treatment naïve tumors using mass cytometry. Tumors were harvested on day 14 after implantation and stained with a 37-marker antibody panel. Density viSNE plots were used to visualize an even number of CD45 +cells from MOC1 or MOC1esc1 tumors. (D) ViSNE plots of tumor infiltrating CD45 +cells overlaid with the expression of selected markers. (E) Frequency within CD45 +cells of major immune cell compartments in treatment naïve MOC1 and MOC1esc1 TME. The percentage of CD45 +live cells in each condition is: MOC1:88.3±5.8%, MOC1esc1: 77±5.8%. (*P<0.05, **p<0.01, ***p<0.001. Significance was calculated by unpaired Student’s t-test. Data are shown as mean±SEM, N=4 per group). DC, dendritic cell; FDR, false discovery rates; MOC1, murine oral carcinoma; ViSNE: visual stochastic network embedding; TAMs, tumor-associated macrophage.

