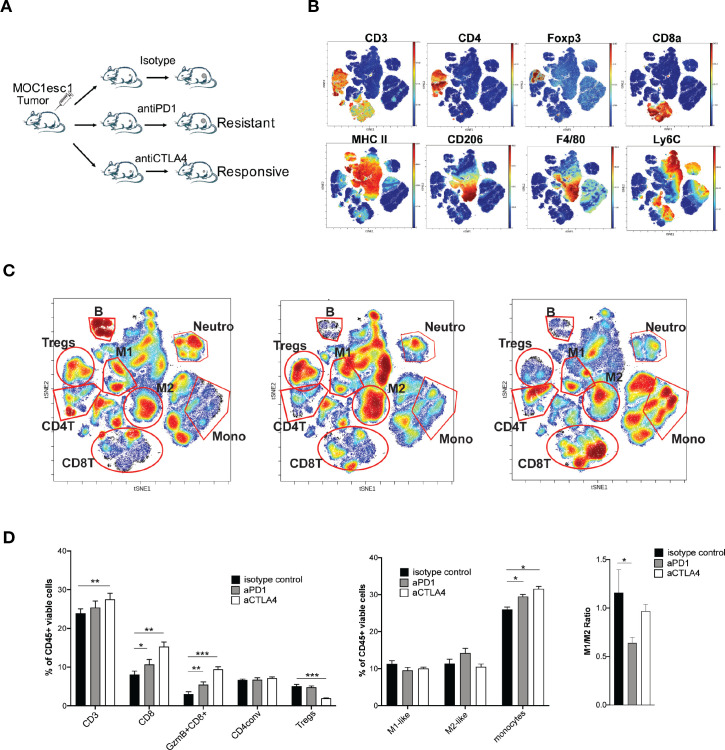
Figure 3.
Tregs and M2-like TAMs contribute to MOC1esc1 anti-PD1 resistance. (A) Schematic of MOC1esc1 tumor bearing mice treatment and analysis. MOC1esc1-bearing mice were treated with isotype control, anti-PD1, or anti-CTLA4 monoclonal antibodies on days 3, 6, 9 after tumor implantation. Tumors were harvested on day 12 and subsequently analyzed by a 37-marker panel using CyTOF. (B) ViSNE plots of tumor infiltrating CD45 +cells overlaid with the expression of selected markers. T cells: CD3+, CD8 +T cells: CD3 +CD8+, GzmB +CD8+T cells: CD3 +CD8+GzmB+, Tregs: CD3 +CD4+Foxp3+, CD4conv: CD3 +CD4+Foxp3-, B cells: CD19+, NK cells: NK1.1+, M2-like macrophage: CD11b+F4/80+Ly6C-Ly6G-CD206+, M1-like macrophage: CD11b+F4/80+Ly6C-Ly6G-CD206-, Neutrophils: CD11c-CD11b+Ly6G+, Monocytes: CD11c-CD11b+Ly6G-Ly6C+. (C) Profiling of MOC1esc1 TME under indicated treatments gated on CD45 +cells. Density viSNE plots were used to visualize an even number of CD45 +cells from three indicated treatment groups. Selected major immune populations were labeled. (D) Frequency of major immune compartments in MOC1esc1 tumors under different treatment conditions. The percentage of CD45 +live cells in each condition is: isotype control: 88.2±3.1%, anti-PD1:87.4±1.3%, anti-CTLA4:89.9±2%. (*P<0.05, **p<0.01, ***p<0.001. Significance was calculated by one-way ANOVA. Data are shown as mean±SEM, n=5 mice per group). ANOVA, analysis of variance; MOC1, murine oral carcinoma; TAMs, tumor-associated macrophages; TME, tumor microenvironment.

