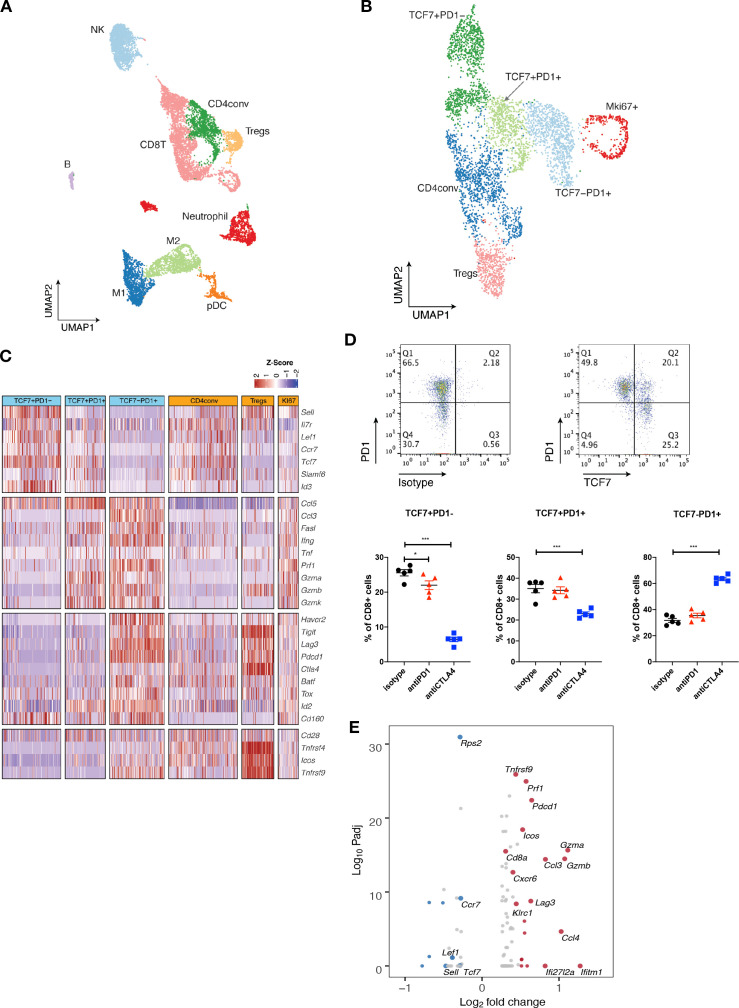
Figure 4.
Single-cell RNA-seq analysis defines distinct subsets of CD8 TILs. (A) UMAP of scRNA-seq results of total tumor infiltrating CD45 +cells pooled from different treatment groups. Tumor infiltrating CD45 +cells from 5 mice in the same treatment group were pooled and subjected to single cell sequencing. (B) UMAP of total T cells in MOC1esc1 tumors colored by indicated major subsets. T cells from all three conditions were pooled for clustering analysis. (C) Heatmap illustrating the relative gene expression levels of genes in major T cell subsets in MOC1esc1 tumors. (D) Tcf7 +Pd1−, Tcf7 +Pd1+, and Tcf7-Pd1+CD8+T cells in MOC1esc1 tumors were detected by flow cytometry. Dot plot was pre-gated on live CD8 +T cells. Percentages of CD8 +subsets in MOC1esc1 tumors at indicated treatment condition are shown. MOC1esc1 tumors treated with isotype control, anti-PD1, or anti-CTLA4 were harvested at day 12 postinoculation and analyzed by flow cytometry for CD8 +T cell subset distribution (*p<0.05, ***p<0.001). Significance was calculated by one-way ANOVA. Data are shown as mean±SEM, n=5 mice per group.) (E) Pseudo-bulk differential expression analysis was performed in total CD8 +T cells between responder (anti-CTLA4) and control MOC1esc1 tumors. Colors of dots represent the anti-CTLA4 treated MOC1esc1 infiltrating CD8 +T cell upregulated genes (red) and downregulated genes (blue) compared with control. The statistical significance (log10 FDR) was plotted against the log2 fold-change of gene expression levels. ANOVA, analysis of variance; FDR, false discovery rates; MOC1, murine oral carcinoma; TILs, tumor infiltrating lymphocytes; UMAP, uniform manifold approximation and projection.

