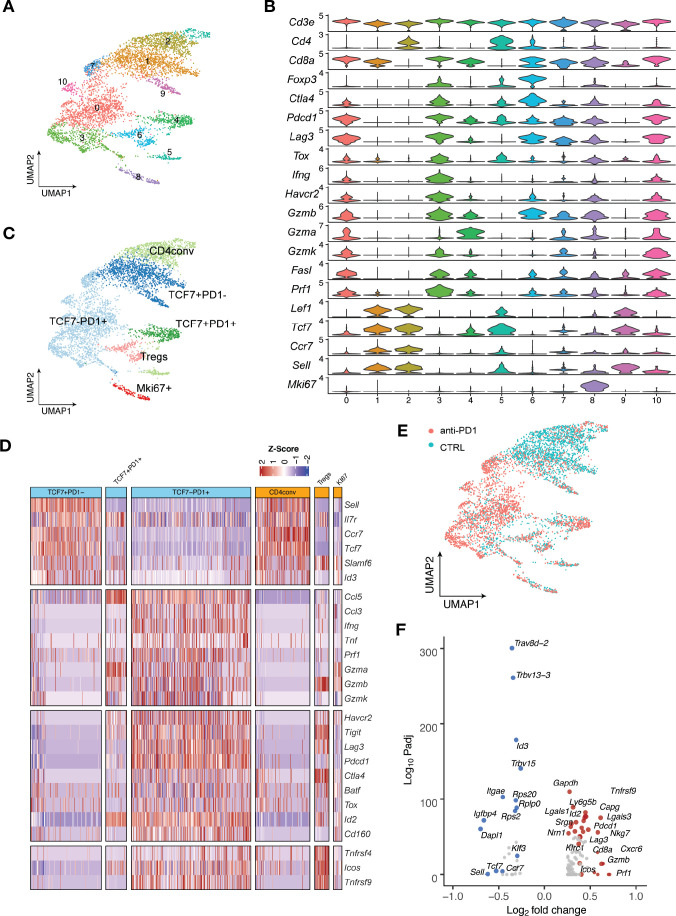
Figure 6.
Major TIL subsets and the transcriptomic dynamics in MOC22 tumors with anti-PD1 treatment. A total of 5, 548 T cells were sequenced in MOC22 tumors treated with isotype control or anti-PD1. T cells from five mice in each treatment group were pooled and subjected to single cell sequencing. (A) UMAP of T cells in MOC22 tumors colored by individual clusters. (B) Violin plots showing expression of selected immune cell marker genes across clusters. The y axis represents the normalized gene expression levels. (C) UMAP of total T cells in MOC22 tumors colored by indicated major subsets. T cells from both conditions were pooled for clustering analysis. (D) Heatmap illustrating the relative gene expression levels of genes in major T cell subsets in MOC22 tumors. (E) UMAP of T cells in MOC22 tumors colored by treatment conditions. (F) Pseudobulk differential expression analysis was performed in total CD8 +T cells between anti-PD1 and isotype control treated MOC22 tumors. The results were presented by a color-coded volcano plot. The statistical significance (log10 FDR) was plotted against the log2 fold-change of gene expression levels. Each dot represents one gene, which is color coded by the most highly enriched genes. FDR, false discovery rates; MOC, murine oral carcinoma; TIL, tumor infiltrating lymphocytes.

