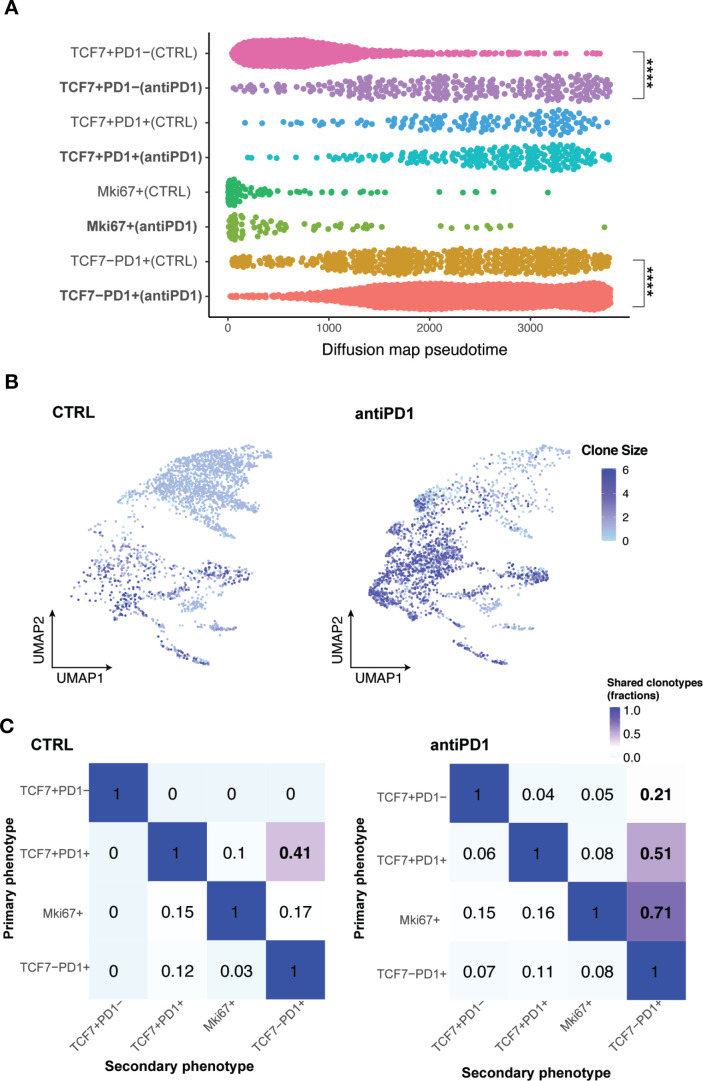
Figure 7.
TCR-based lineage tracing showing CD8 +TILs differentiation in MOC22 tumors with anti-PD1 treatment. (A) Diffusion pseudotime of indicated CD8 +T cell subsets in different treatment conditions. ****p<0.0001. Significance was calculated by two-tailed Student’s t-test.) (B) Heatmap of TCR clone size in MOC22 tumors. Cells were colored by TCR clone size on a log2 scale in the UMAP of T cells in indicated conditions. (C) Shared fraction analysis heatmaps of TCR clonotypes between primary and secondary phenotypes in indicated conditions of MOC22. MOC, murine oral carcinoma; TILs, tumor infiltrating lymphocytes.

