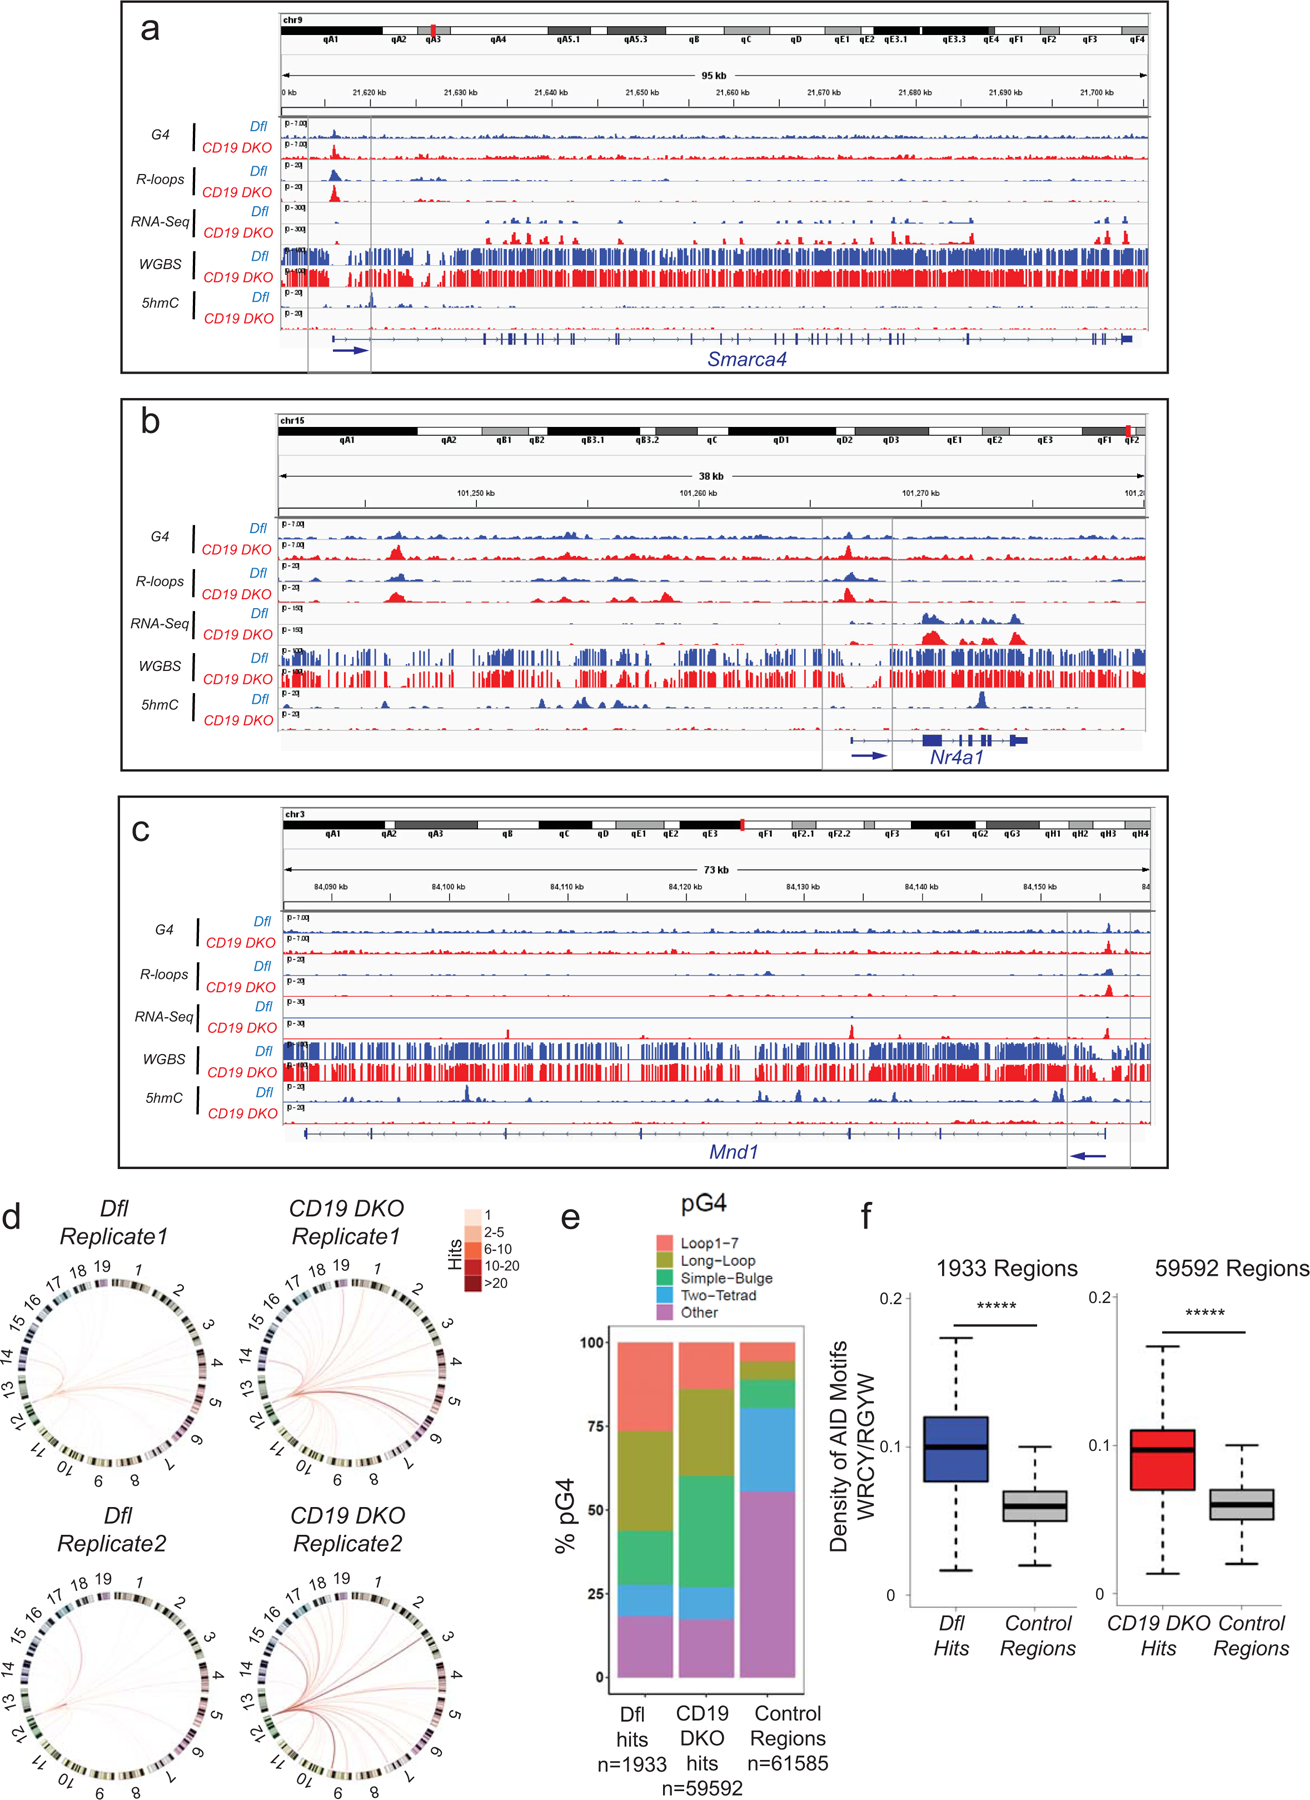
Extended data figure 7. Genome-wide analysis of TET deficient B cells.

a)–c) Genome browser tracks showing the distribution of G-quadruplexes (G4), R-loops, RNA-Seq, WGBS, and 5hmC datasets for Dfl (blue tracks) and CD19 DKO (red tracks) B cells. Grey boxes indicate regions of interest. The blue arrows at the bottom show the location of the TSS and the direction of transcription. d) Circos plots to visually depict all translocations identified by HTGTS in Dfl and CD19 DKO replicates. Colored lines connect the Sµ bait with the translocation partner regions. Color scale represents the number of translocation partner regions identified in a 10 kb window. Translocations from two Dfl and CD19 DKO replicates are represented separately. e) Relative representation of different classes of motifs predicted to form G-quadruplexes (pG4) in control genomic regions selected randomly (right bar) and +/−300 bp from the center of translocation partner junctions identified from translocations in Dfl and CD19 DKO B cells (right bar). The numbers (n) of Dfl and CD19 DKO hits, and control regions are included in the plots. f) Density of AID motifs (WRCY/RGYW) in +/−300bp from the center of translocation partner junctions identified from translocations in Dfl and CD19 DKO B cells compared to control random regions in euchromatin (Hi-C A compartment) from 2 biological replicates. Statistical significance is calculated using the Wilcoxon signed rank test f), ***** p value <0.000001.
