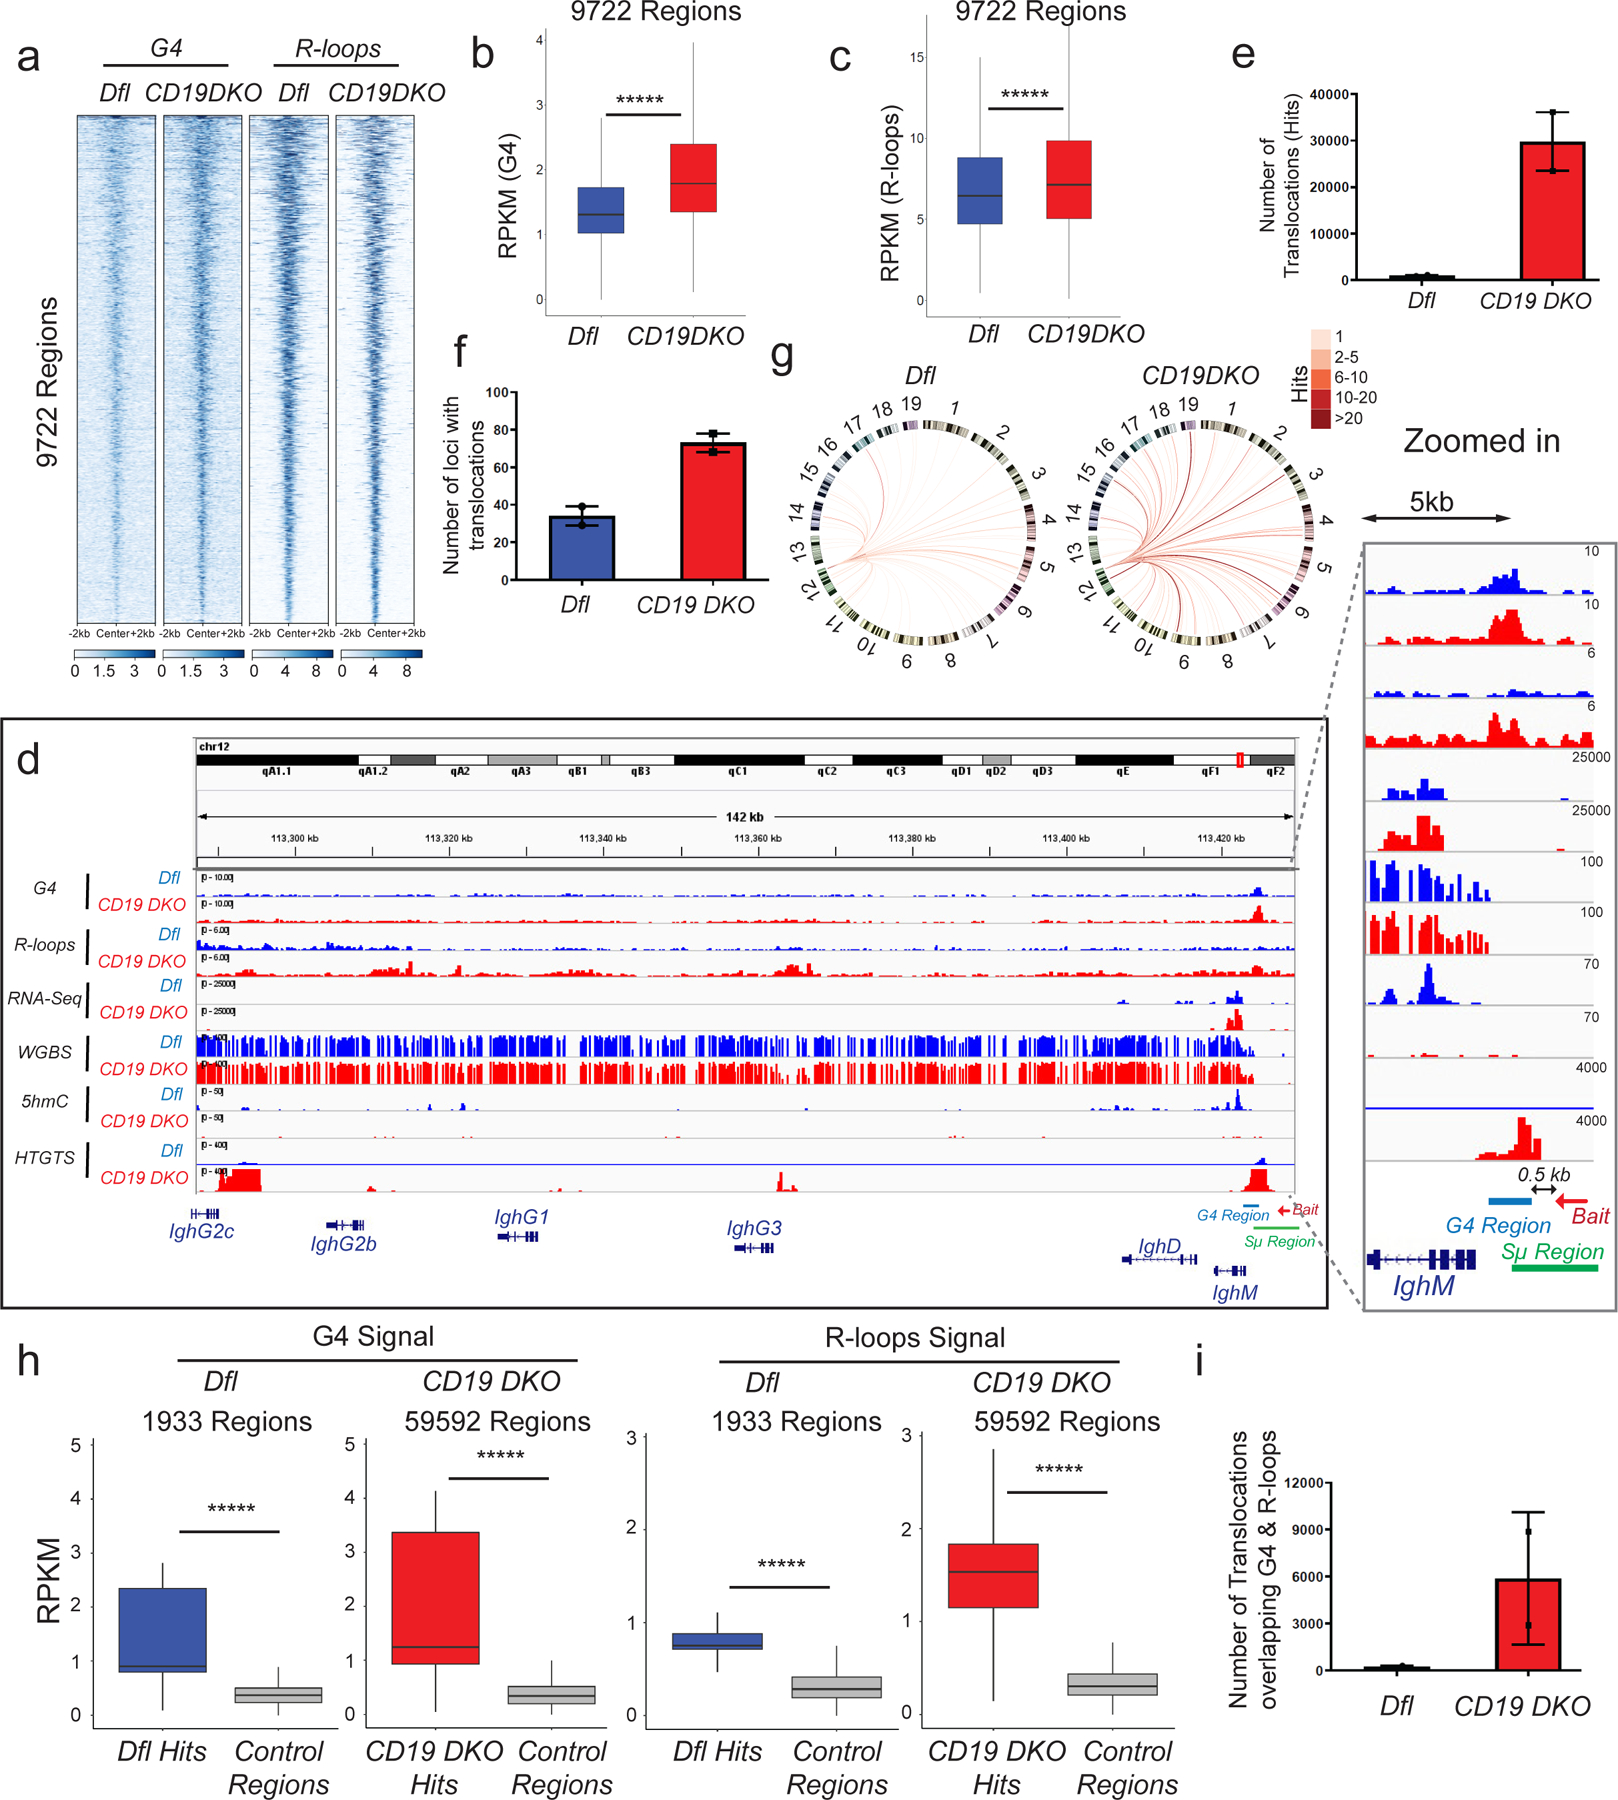
Figure 4. TET-deficient B cells show a genome-wide increase in G-quadruplexes and R-loops and increased translocations to Ig switch regions.

a) Heatmap showing enrichment of G-quadruplex (G4) structures (average of 2 replicates) and R-loops (average of 3 replicates) in Dfl and CD19 DKO B cells. Reads per million (RPM) values in 9722 regions with overlapping high intensity signals for both G-quadruplexes and R-loops are plotted in +/− 2 kb windows from the center of the region. b), c) Box and whisker plots quantifying enrichment (RPKM, reads per kilobase per million) of (b) G-quadruplex structures (2 biological replicates) and (c) R-loops (3 biological replicates) in the 9722 regions from Dfl and CD19 DKO B cells. d) Genome browser view showing data from Dfl (blue tracks) and CD19 DKO (red tracks) B cells. Green and blue bars at the bottom show the location of Sµ and G4 regions. The red arrow indicates the bait sequence located 5’ of the switch µ (Sµ) region used to capture translocations by HTGTS. The zoomed in panel on the right shows the distribution of signals around the IghM region. e)- f) Quantification of (e) total number of translocations (hits), and (f) the number of genomic loci to which translocations occur in CD19 DKO and Dfl B cells from 2 biological replicates. g) Circos plots to visually depict all translocations identified by HTGTS in Dfl and CD19 DKO. Colored lines connect the Sµ bait with the translocation partner regions. Color scale represents the number of translocations identified in a 10 kb window. Translocations from two Dfl and CD19 DKO replicates were concatenated for this representation. h) Box and whisker plots quantifying G-quadruplexes (left panel) and R-loops (right panel) RPKM signal in translocation partner regions of translocations identified in CD19 DKO and Dfl B cells. Regions were extended +/−1 kb from the center of the junctions in the translocation partner regions from 2 biological replicates. i) Quantification of the number of translocations (hits) overlapping G-quadruplexes and R-loops regions in CD19 DKO and Dfl B cells from 2 biological replicates. Statistical significance is calculated using Kruskal-Wallis test and the ad hoc Dunn’s test in b), c) and h). Boxes in box and whisker plots represent median (center) with 25th to 75 th percentile and whiskers represent maxima/minima. Error bars represent mean +/− standard deviation, ***** p value <0.000001.
