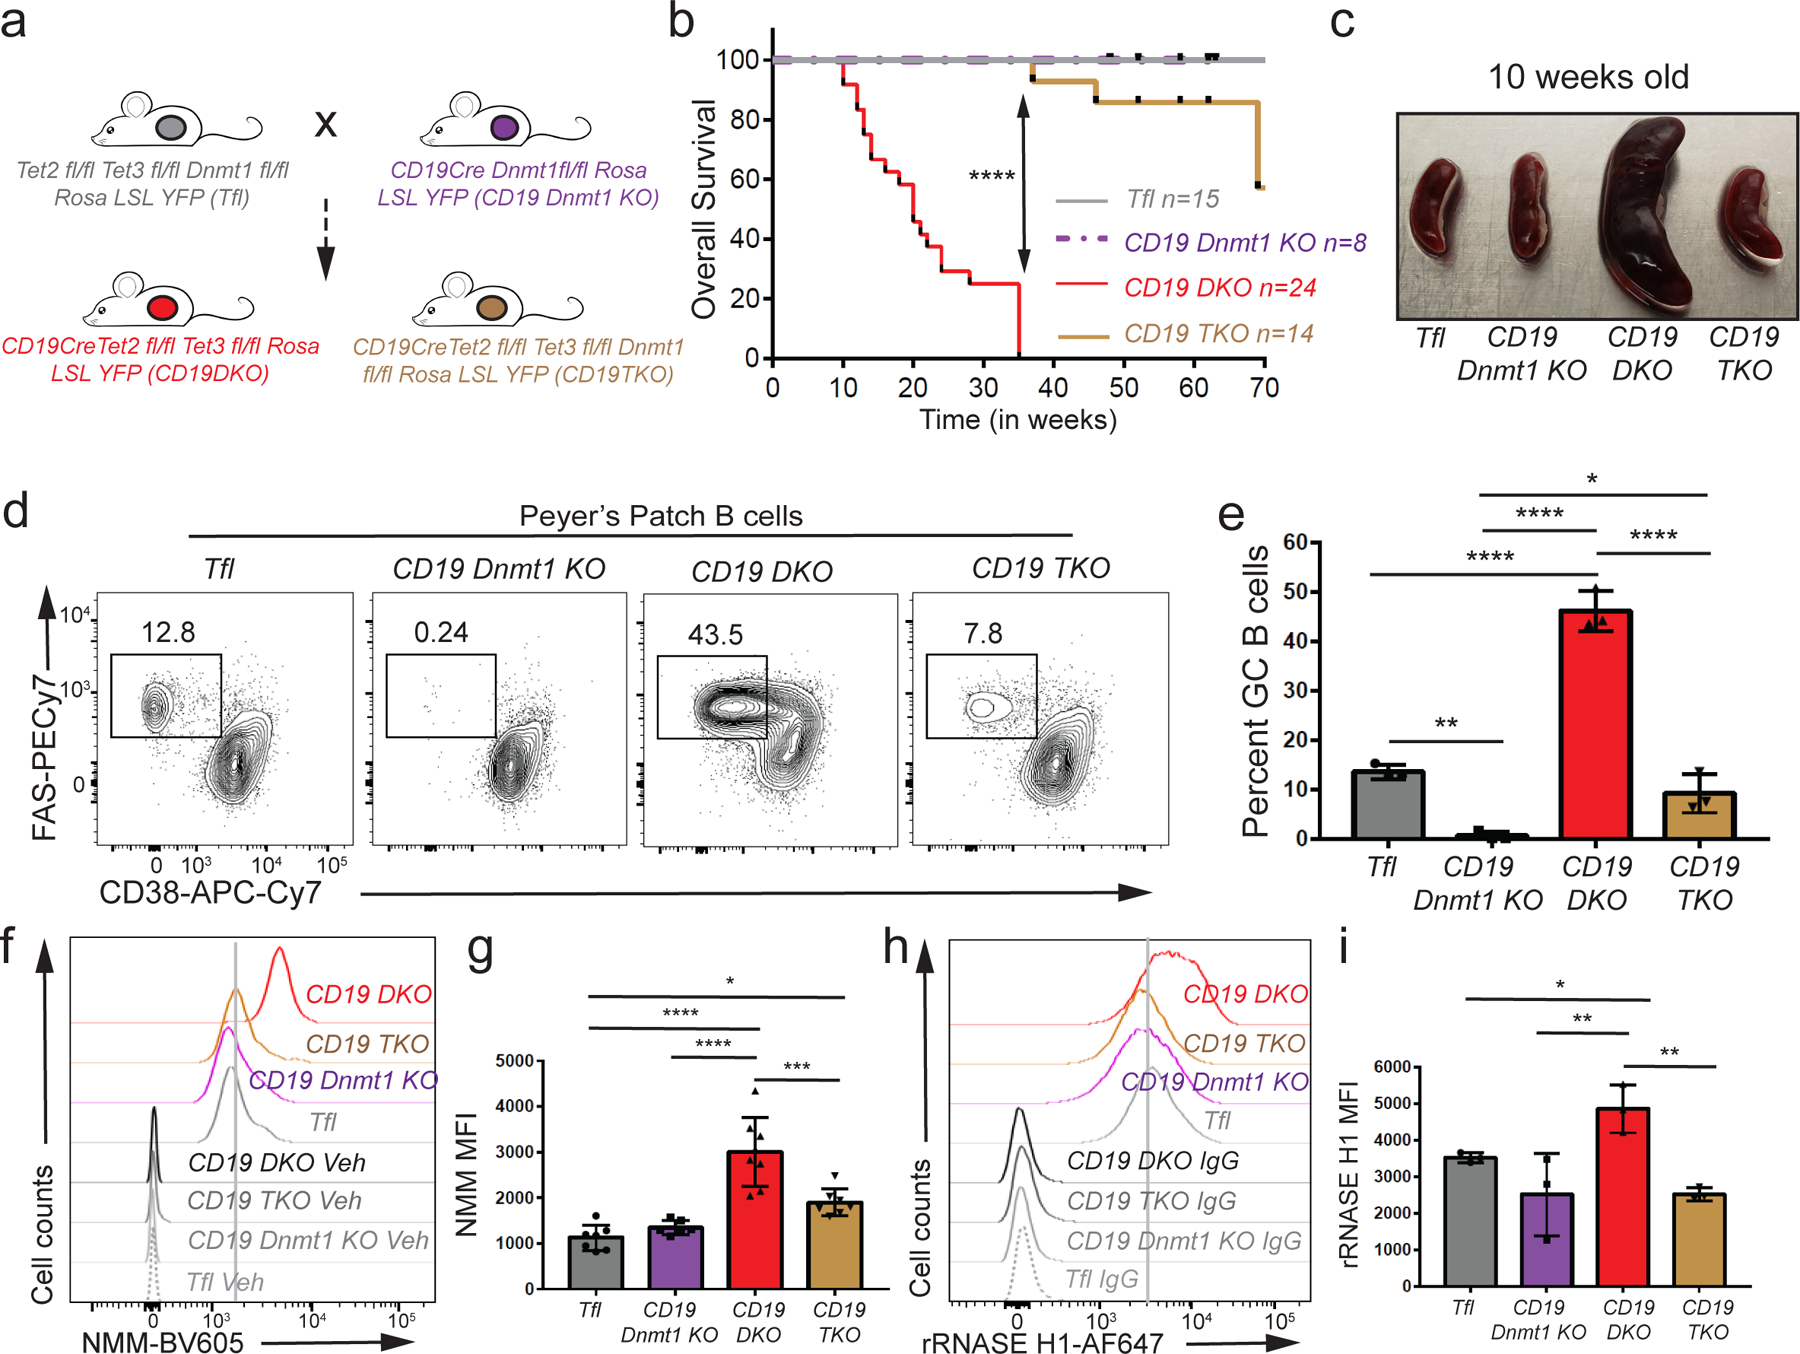
Figure 5. DNMT1 deletion delays oncogenesis in TET-deficient mice.

a) Breeding strategy used to generate the triple Dnmt1,Tet2,Tet3 deficient mice(CD19TKO). b) Kaplan-Meir curves displaying the overall survival of Tfl (grey), CD19 Dnmt1 KO (purple), CD19 DKO (red) and CD19 TKO (brown) mice. Y-axis denotes percent survival and X-axis shows time in weeks. c) Spleens from 10 week-old Tfl, CD19 Dnmt1, CD19 DKO and CD19 TKO mice. d) Representative flow cytometry data gated on Peyer’s patch B cells from 10 week-old Tfl, CD19 Dnmt1 KO, CD19 DKO and CD19 TKO mice. Numbers represent frequency of GC B cells, identified as FAS+ (Y-axis) and CD38− (X-axis). e) Quantification of GC B cell frequency in Peyer’s patches of Tfl (YFP−, grey), CD19 Dnmt1 KO (YFP+, purple), CD19 DKO (YFP+, red) and CD19 TKO (YFP+, brown) mice from 3 biological replicates and 2 independent experiments. f) Flow cytometric detection of G-quadruplexes by staining of permeabilized cells with NMM or DMSO vehicle controls (Veh) in B cells from Tfl (YFP−), CD19 Dnmt1 KO (YFP+), CD19 DKO (YFP+) and CD19 TKO (YFP+) mice. g) Quantification of median fluorescence intensity (MFI) of NMM signal from Tfl, CD19 Dnmt1 KO, CD19 DKO and CD19 TKO B cells from 7 biological replicates and 5 independent experiments. h) Flow cytometric detection of R-loops using V5-epitope-tagged recombinant RNASE H1 (rRNASE H1) in B cells from Tfl (YFP−), CD19 Dnmt1 KO (YFP+), CD19 DKO (YFP+) and CD19 TKO (YFP+) mice. Samples stained with anti-V5 and anti-rabbit secondary antibodies were used as controls (IgG). i) Quantification of median fluorescence intensity (MFI) of R-loops (rRNASE H1) signal from Tfl, CD19 Dnmt1KO, CD19 TKO and CD19 DKO B cells from 3 biological replicates and 2 independent experiments. Statistical significance is calculated using one-way ANOVA. Error bars represent mean +/− standard deviation, * p value ≤0.05, ** p value ≤0.01, *** p value ≤0.0005 **** p value <0.0001.
