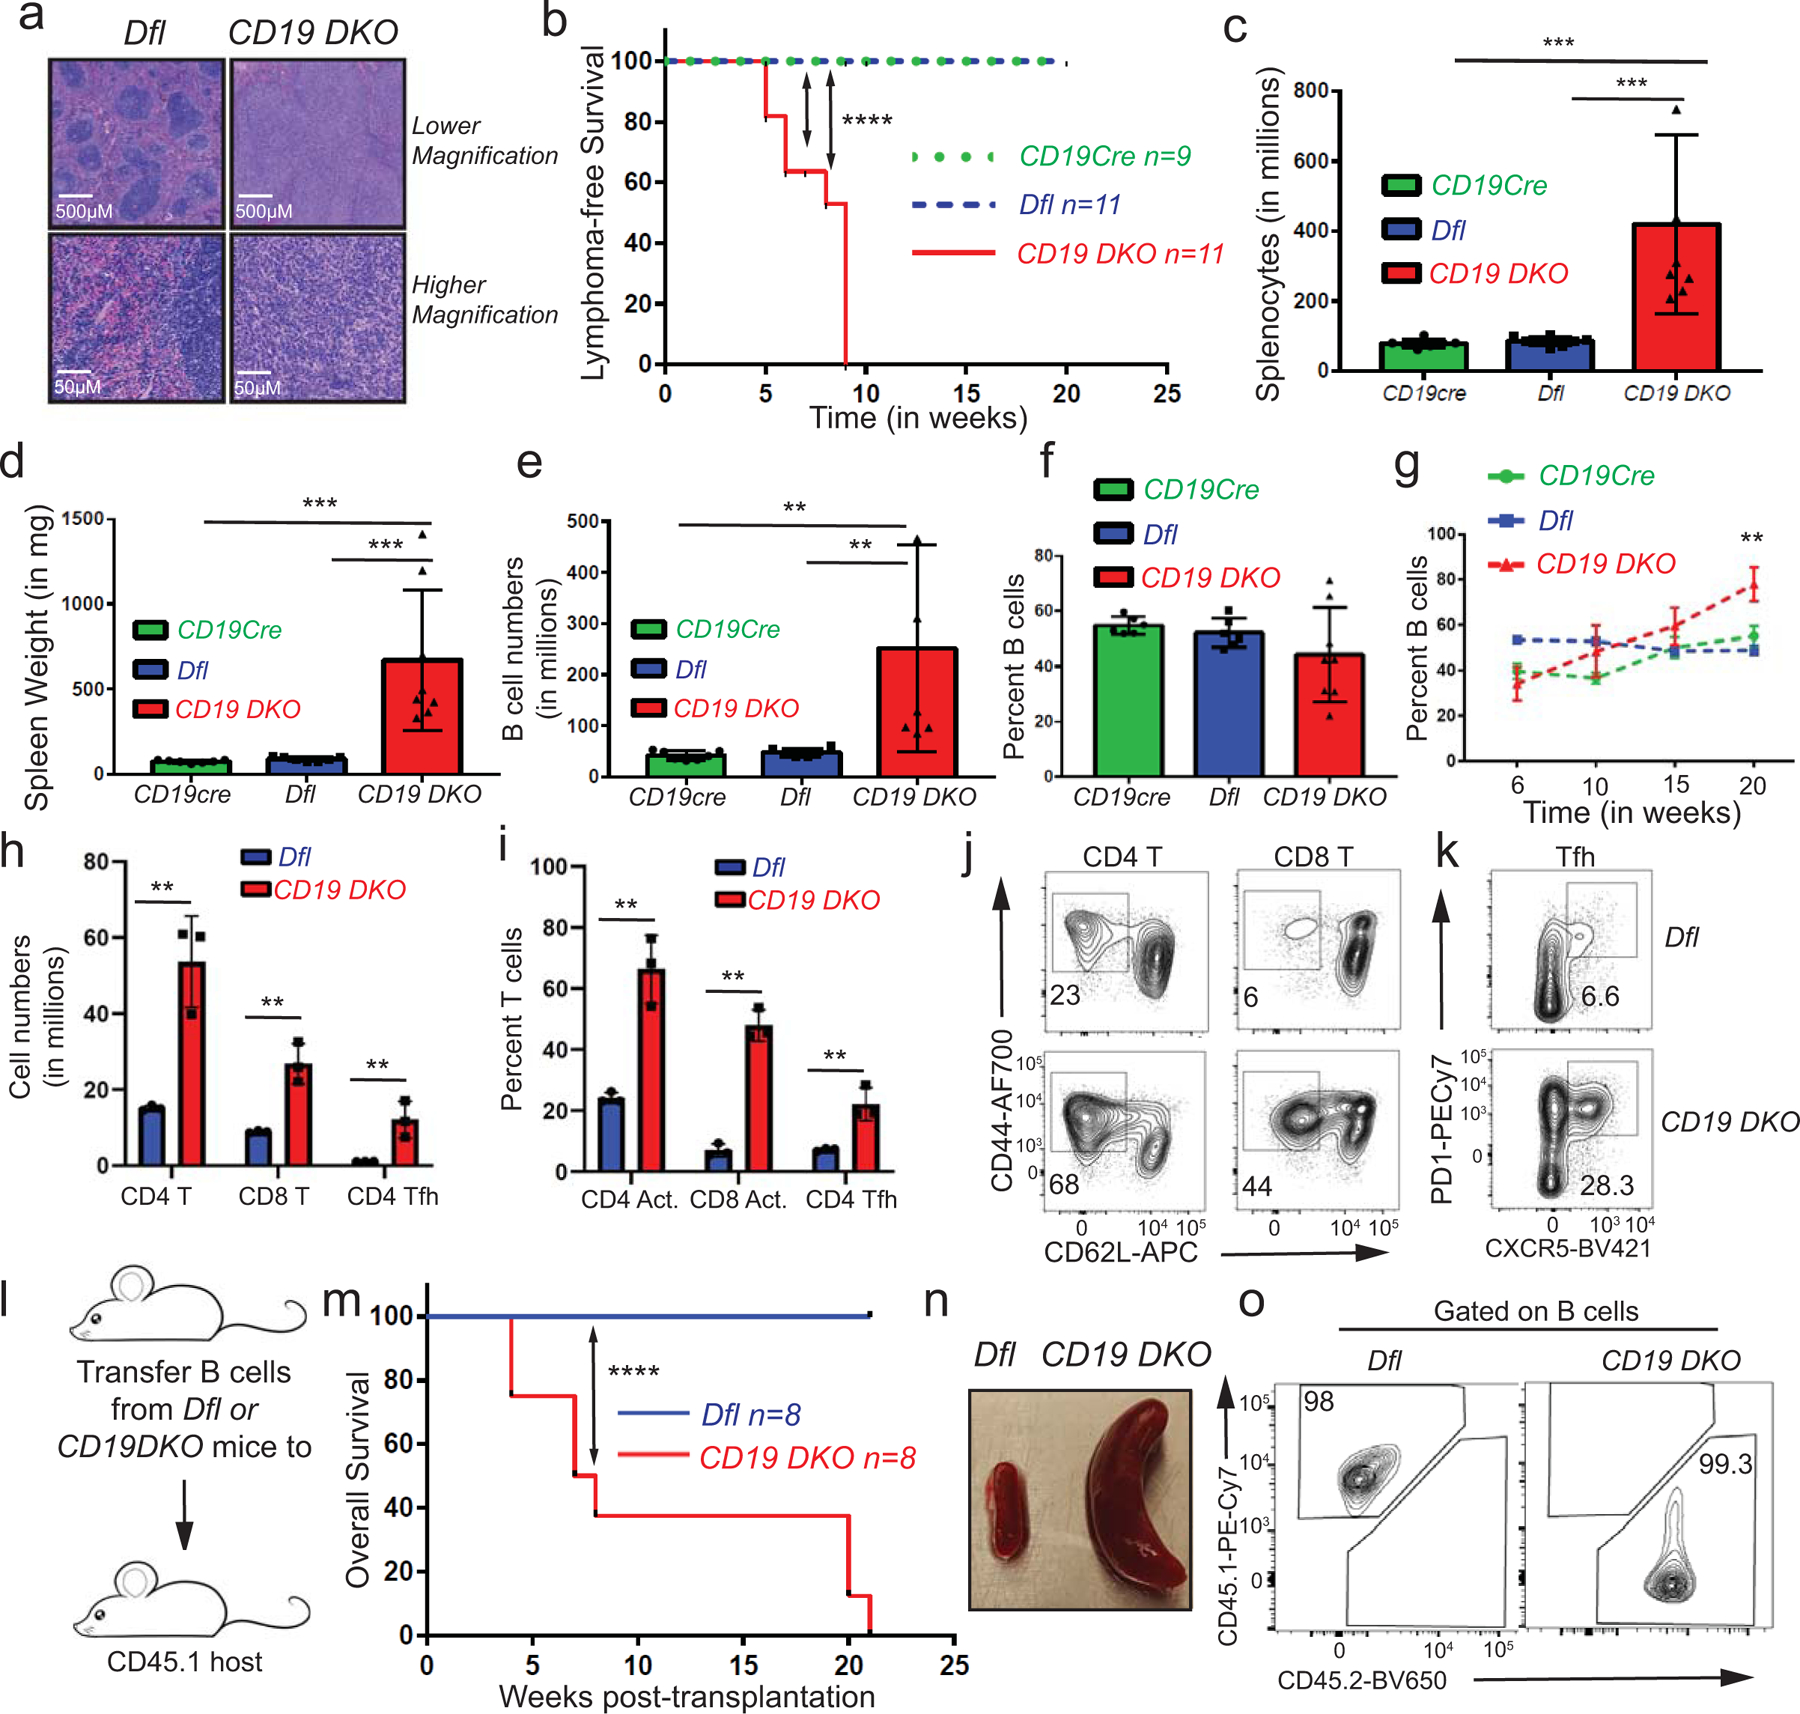
Extended data figure 1. TET deficiency leads to development of mature B cell lymphoma.

a) H&E staining in spleens from 8 week-old Dfl and CD19 DKO mice The data is representative of 2 independent experiments. b) Kaplan-Meir curves displaying lymphoma-free survival of CD19 DKO (red) and control Dfl (blue) and CD19 Cre (green) mice. Y-axis, percent mice without lymphoma, defined by ≥ 3-fold increase in spleen weight and ≥ 2-fold increase in cellularity. c) – f) Quantification of c) cell numbers, d) spleen weights, e) B cell numbers, f) percent of B cells in spleens of 9 week-old CD19 DKO (red) and control Dfl (blue) and, CD19 Cre (green) mice from at least 5 biological replicates and 4 independent experiments. g) Percent of B cells in spleens of CD19 DKO (red) and control Dfl (blue) and CD19 Cre (green) mice at different ages from 3 independent experiments. h) Quantification of cell numbers of CD4+ T, CD8+ T and CD4+ Tfh cells from spleens of 9 week-old CD19 DKO (red) and control Dfl (blue) mice from 3 biological replicates and 2 independent experiments. i) Percent of activated CD4+ and, CD8+ T cells, and CD4 Tfh cells from spleens of 9 week-old CD19 DKO (red) and control Dfl (blue) mice from 3 biological replicates and 2 independent experiments. j) and k) Flow cytometry plots of j) Activated CD62Llow (X-axis) and CD44+ (Y-axis) CD4+ and CD8+ T cells and k) CD4+ Tfh cells PD1+ (Y-axis) CXCR5+ (X-axis) from spleen of 9 week-old CD19 DKO (red) and control Dfl (blue) mice. Numbers represent frequency of gated populations. l) Scheme of adoptive transfer experiment. B cells from Dfl and CD19 DKO CD45.2 mice were transferred retro-orbitally into sub-lethally irradiated CD45.1 immunocompetent host mice. m) Kaplan-Meir curves displaying overall survival of CD45.1 host mice transplanted with B cells from Dfl or CD19 DKO mice. X-axis denotes time in weeks after transplantation. n) Enlarged spleens in CD45.1 host mice transplanted with CD19 DKO compared to Dfl B cells 8 weeks after adoptive transfer. o) Representative flow cytometry data from the spleens of CD45.1 host mice 8 weeks after transplantation with Dfl and CD19 DKO B cells. Frequencies of the CD45.1+ and CD45.2+ cell populations are shown. Statistical significance is calculated using the log-rank test for b) and m), one-way ANOVA for c)–f) and two-way ANOVA for g)–i). Error bars represent mean +/− standard deviation, ** p value ≤0.01 *** p value ≤0.001, **** p value ≤0.0001.
