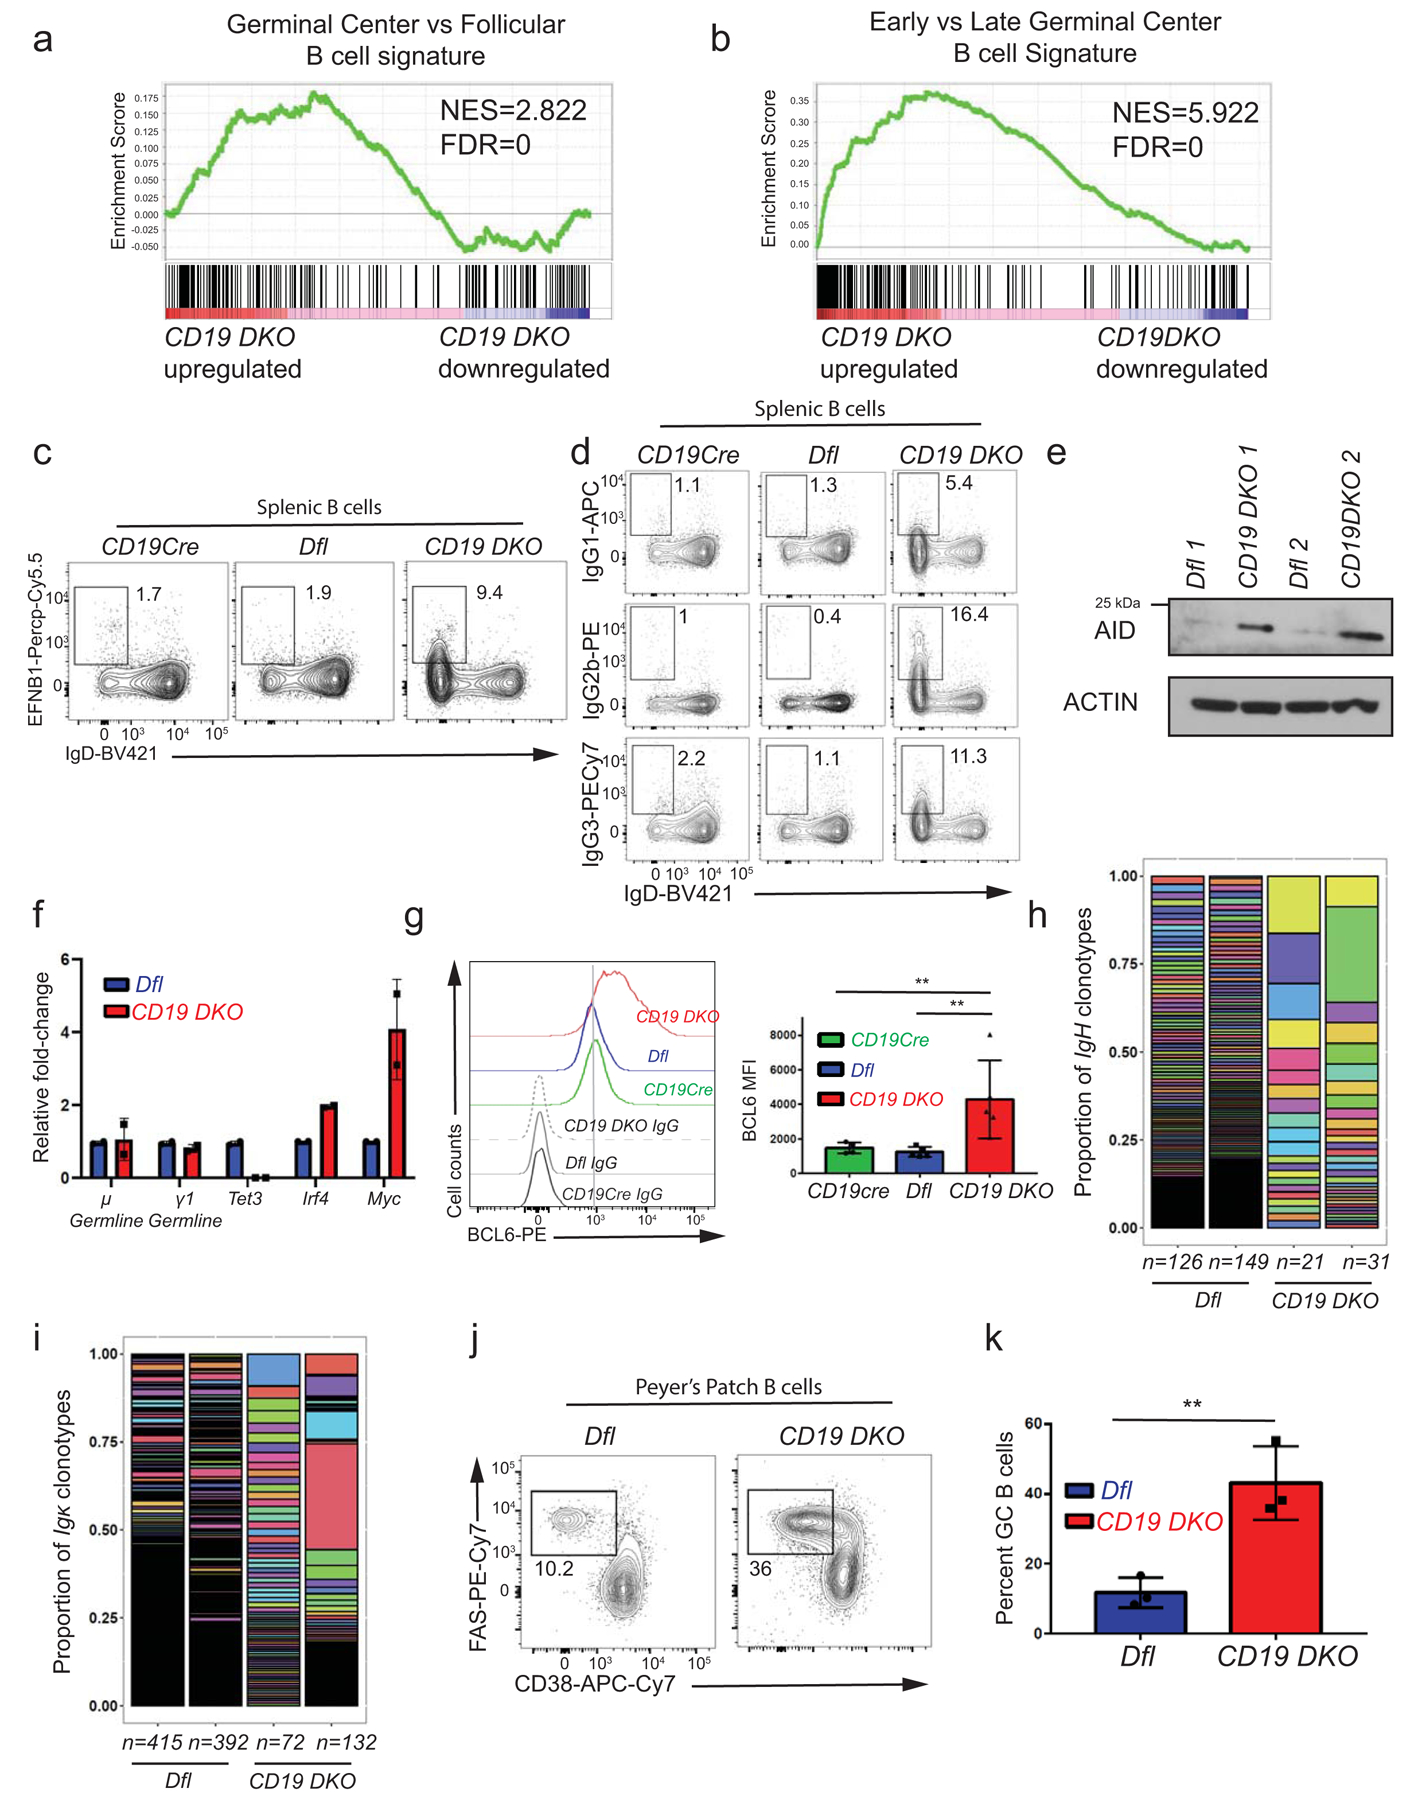
Extended data figure 2. Expanded B cells from CD19 DKO mice have a germinal center (GC) origin.

a), b) Gene set enrichment analysis (GSEA) plots showing enrichment for a GC B cell transcriptional signature in the transcriptional profile of CD19 DKO compared to Dfl B cells, using gene sets from a) GC versus follicular B cells and b) early GC versus late GC B cells. Y-axis denotes enrichment score. NES, Normalized enrichment score, FDR, False discovery rate. c) Representative flow cytometry data gated on splenic B cells from 8 week-old Dfl, CD19Cre (YFP+) and CD19 DKO (YFP+) mice. Numbers in the rectangles represent frequencies of GC B cells, identified as EFNB1+ (Y-axis) and IgDlow (X-axis). d) Representative flow cytometry data showing Ig isotype expression, gated on splenic B cells from 8 week-old Dfl, CD19Cre (YFP+) and CD19 DKO (YFP+) mice. Top, IgG1; middle, IgG2b; bottom, IgG3 X-axis shows expression of the default IgD isotype. Numbers represent frequencies of gated cell populations. e) Immunoblot showing AID expression in Dfl and CD19 DKO B cells (2 replicate experiments). Actin is used as a loading control. f) Relative fold-change in expression of μ and γ1 germline, Tet3, Irf4 and Myc transcripts measured by qRT-PCR in Dfl and CD19 DKO B cells from 2 biological replicates. g) Histogram (left panel) and bar-graph (right panel) showing staining with BCL6 antibody compared to isotype IgG controls in B cell from 8 week-old CD19Cre, Dfl and CD19 DKO mice from 3 independent experiments. h) and i) Bar plots displaying the proportions of (h) IgVH and (i) Igκ clonotypes (rearranged variable gene segments) from Dfl (blue) and CD19 DKO (red) B cells, identified from BCR repertoire analysis of RNA-Seq data. Y-axis represents the proportion of each clonotype. Each individual IgVH and Igκ clonotype is displayed using a different color in the bar plots. Numbers at the bottom represent the number of clonotypes identified in two independent replicates of Dfl (blue) and CD19 DKO (red) B cells. j) Representative flow cytometry data gated on Peyer’s patch B cells from 8 week-old Dfl and CD19 DKO mice. Numbers represent frequency of GC B cells, identified as FAS+ (Y-axis) and CD38− (X-axis). k) Quantification of GC B cell frequency in Peyer’s patches of Dfl (blue) and CD19 DKO (red) mice from 3 independent experiments. Statistical significance is calculated using two-tailed student t-test in f), k) and one-way ANOVA in g). Error bars represent mean +/− standard deviation in f), g) and k). ** p value ≤0.01.
