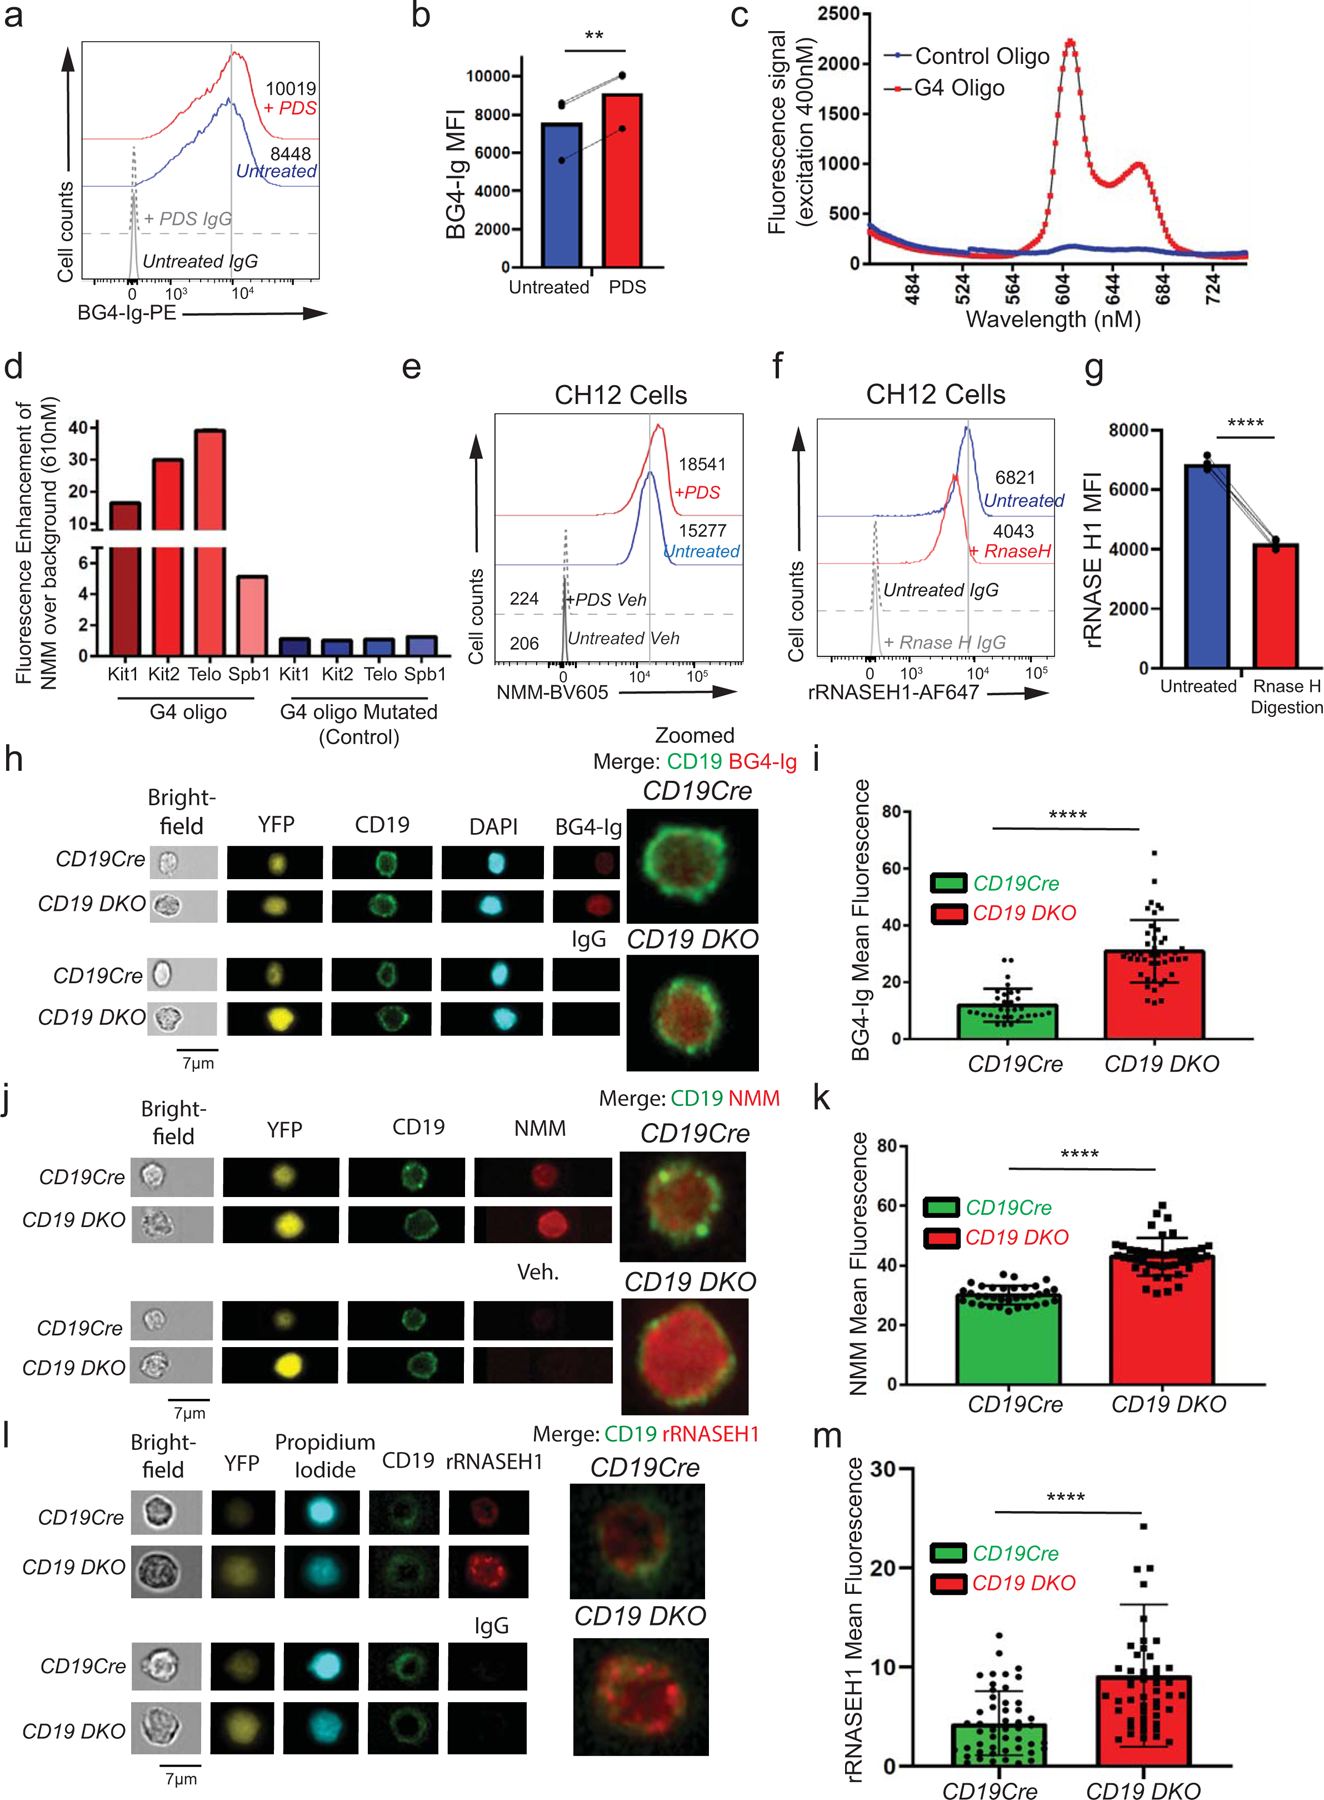
Extended data figure 3. TET deficiency is associated with increased levels of G-quadruplexes and R-loops.

a) Flow cytometric detection of G-quadruplexes with BG4-Ig antibody or isotype IgG controls in primary B cells stimulated with 25 µg/ml LPS for 48 hours and treated with 10 µM pyridostatin (PDS, G4 ligand) for 24 hours. Numbers represent median fluorescence intensity. b) Quantification of median fluorescence intensity (MFI) of BG4-Ig signal from primary B cells treated with (red) or without (blue) PDS. Lines connect paired samples treated with or without PDS from 3 independent experiments. c) Fluorescence emission spectrum of NMM in the presence of a G4-forming oligonucleotide (oligo) from the human c-Kit gene promoter or a control oligo in which guanines in G4-forming regions (G-tracts) were mutated. d) Fluorescence enhancement over background (no oligos) for NMM at 610 nm in presence of known G4-forming oligos (Kit1, Kit2, Spb1) from the c-Kit gene locus or the telomeric repeat (Telo) or their respective mutated versions. e) G-quadruplex levels assessed by NMM or DMSO vehicle control (Veh) staining in untreated CH12 B cells or cells treated with 5 µM pyridostatin (PDS, G4 ligand) for 24 hours. Numbers represent median fluorescence intensity from 3 independent experiments. f) Flow cytometric detection of R-loops using V5-epitope-tagged recombinant RNASE H1 (rRNASE H1) in CH12 cells with or without RNASE H enzyme digestion during staining. Numbers represent median fluorescence intensity. g) Quantification of median fluorescence intensity (MFI) of R-loops (rRNASE H1) signal from CH12 cells with (red) or without (blue) RNASE H enzyme digestion. Lines connect paired samples with or without RNASE H digestion from 3 independent experiments. h) – m) Representative images (h, j, l) and quantification of mean fluorescence signal (i, k, m) of CD19cre and CD19 DKO YFP+ B cells stained with DAPI or propidium iodide and CD19, BG4-Ig (h, i), NMM (j, k) and rRNASE H1 (l, m) or respective controls using the AMNIS imagestream. Data are from two independent experiments. Statistical significance is calculated using paired student t-test in b) and g), two-tailed student t-test i), k) and m). Error bars represent mean +/− standard deviation, ** p value ≤0.01, **** p value ≤0.0001.
