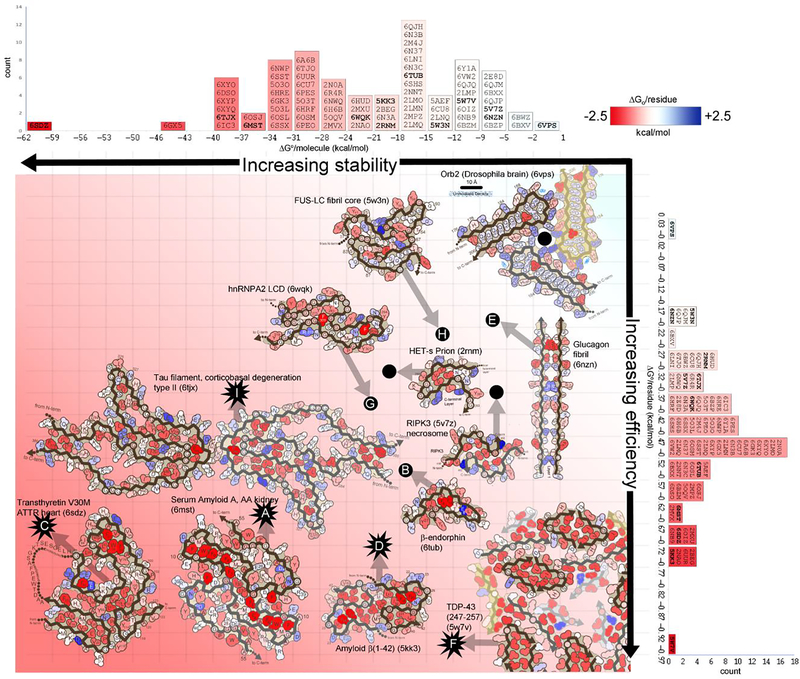
Figure 5. Stabilization energy maps reveal structural features that influence reversibility.
Amyloid fibril structures are colored by energy: strongly stabilizing sidechains are red; destabilizing sidechains are blue. The standard free energies of 75 amyloid structures (indicated by PDB ID codes) are ranked in two dimensions: on a per molecule basis (horizontal histogram) which inform about stability of a molecule, and on a per residue basis (vertical histogram), which inform about energy efficiency (independent of molecule size). Select fibril structures are pictured within the graph. Energy estimates for pathological/irreversible fibrils are indicated with starburst icons. Energy estimates for presumably functional/reversible fibrils are indicated with black dots. Transthyretin V30M (lower left) is evaluated as the most stable structure (62.1 kcal/mol/molecule) and one of the most efficiently stable (−0.68 kcal/mol/residue). It features an abundance of buried hydrophobic residues (deep red). Notably, it is also a pathogenic fibril, extracted from the heart of a patient with hereditary transthyretin amyloidosis. At the opposite extreme, FUS (upper right) is relatively unstable (−12.2 kcal/mol/molecule), and inefficient (−0.20 kcal/mol/residue). It lacks a hydrophobic core. In contrast to transthyretin, FUS aggregation is functional and presumably reversible.

