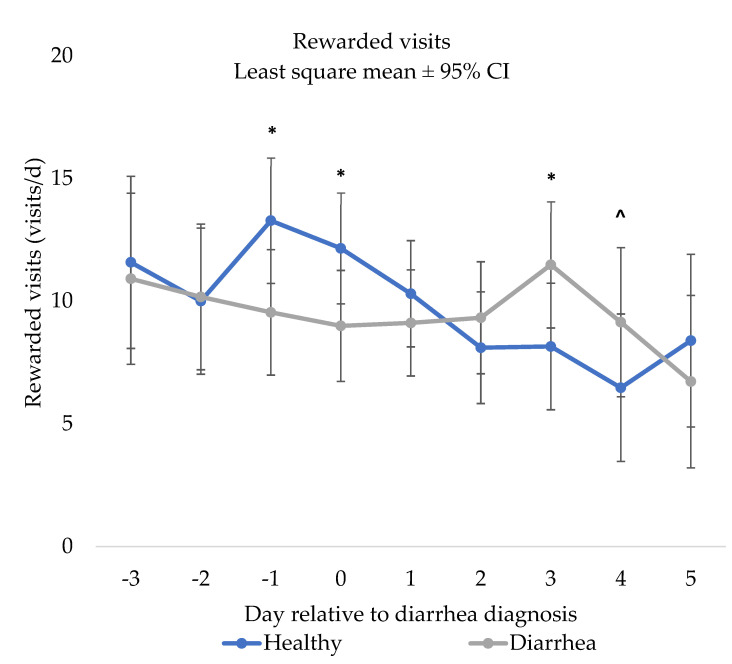
Figure 3.
Results of the repeated measures mixed linear regression model assessing the relationship between day relative to neonatal calf diarrhea diagnosis (day 0) and least square mean rewarded visits (visits/d) of pair matched control (n = 31) and diarrhea (n = 31) calves fed by an automated milk feeder, preweaning. A calf was defined as having NCD if they had a fecal consistency score of 2 or 3 (runny to watery consistency) for two or more consecutive days. Calves were matched on farm, gender and age and the model included calf and pair number to account for the matched pair analysis. The error bars represent ±95% confidence interval. * Indicates a significant difference (p ≤ 0.05), and ^ indicates a tendency (> 0.05 p < 0.10).

