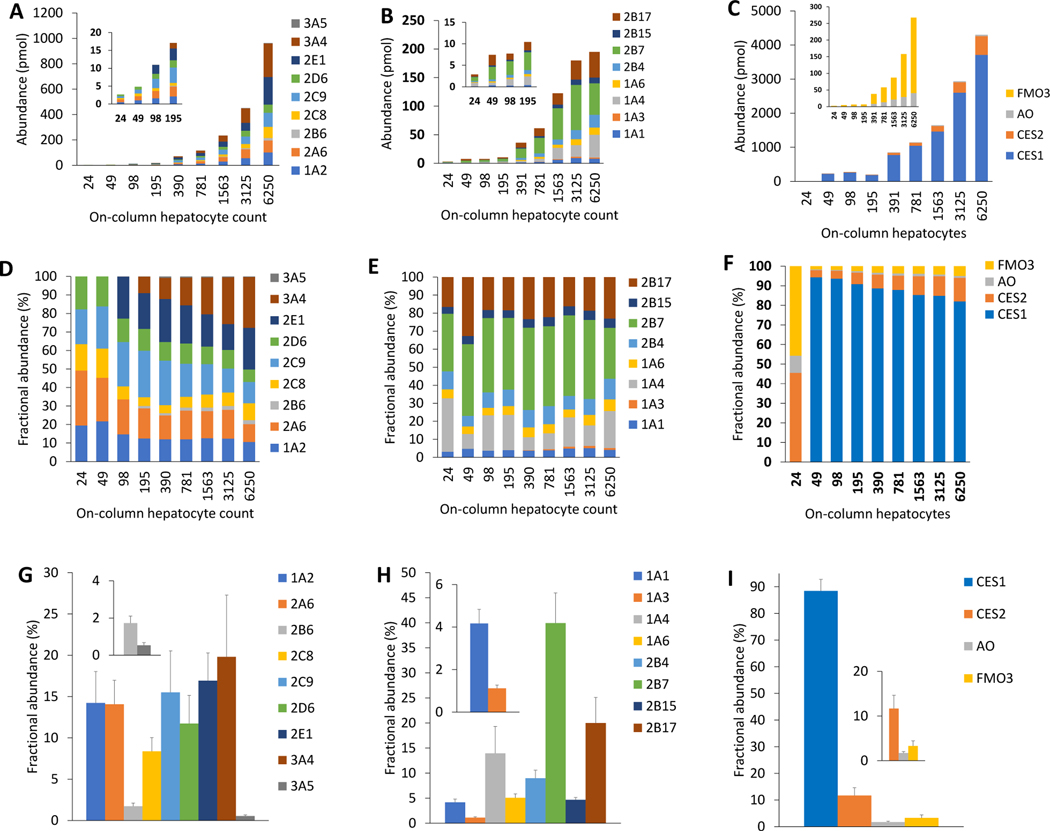
Figure 3:
Protein abundance (pmol) of CYPs (A) UGTs (B), and other non-CYPs (C) in 24–6250 cells human hepatocytes on-column. Cell-count normalized fractional abundance (%) abundance of CYPs (D), UGTs (E), and other non-CYPs (F) calculated by dividing the abundance value by the on-column hepatocyte cell count. Fractional abundance (%) of CYPs (G), UGTs (H), and other non-CYPs (I) reported as means and standard deviations of the cell-count normalized values. CYP3A4, CYP2E1, CYP2B6, CES1, and UGT1A3 were not detected in low cell count. The figure insets are zoomed data for low abundance proteins.

