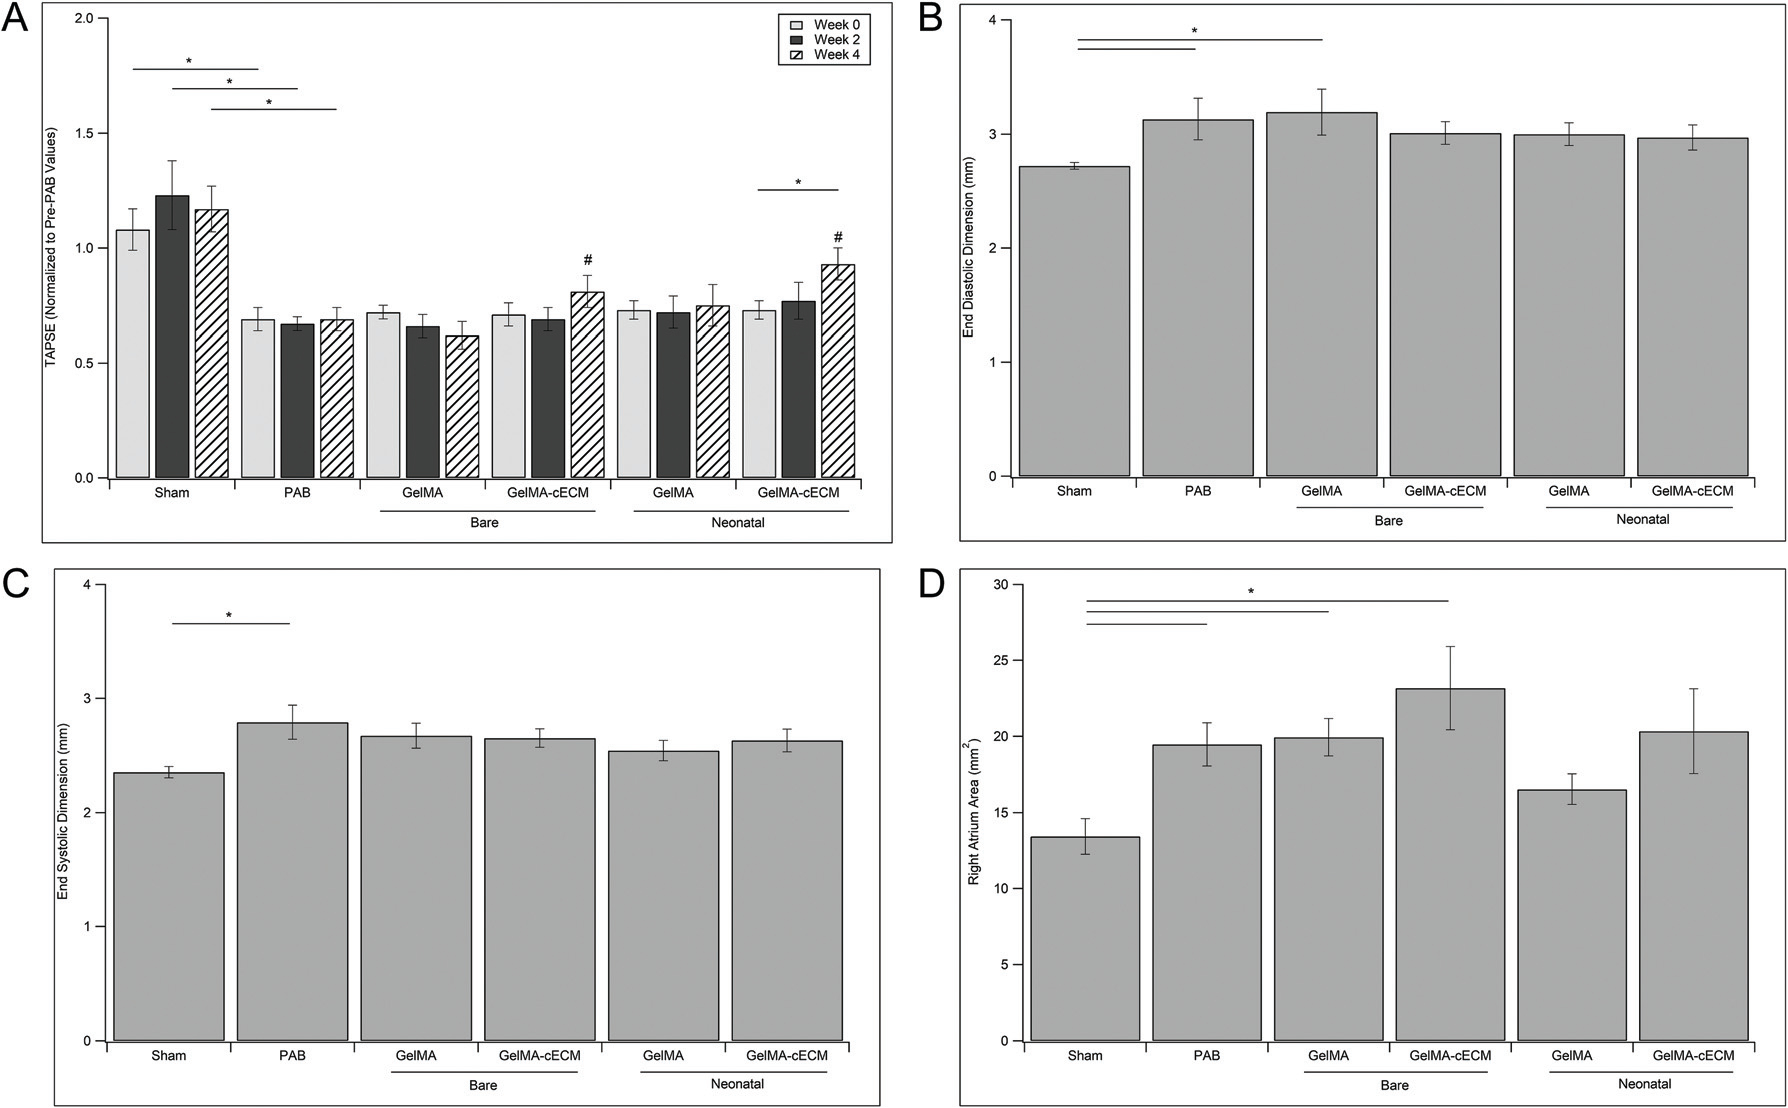
Fig. 2.

Echocardiographic measurements. (A) TAPSE measurements for control, bare patch, and neonatal patch groups across 0–4 weeks of treatment. TAPSE value is normalized to TAPSE at two weeks before patch implantation (immediately before PAB surgery) within rat. * = p-value <0.05, # = no significant difference from Sham group values within week grouping. (B) End-diastolic dimension (EDD) measurements for control, bare patch, and neonatal patch groups at week 4 post-patch implantation. (C) End-systolic dimension (ESD) measurements for control groups, bare patch groups, and neonatal patch groups at week 4 post-patch implantation. (D) Right atrium area (RA-Area) measurements for control groups, bare patch groups, and neonatal patch groups at week 4 post-patch implantation. In figures B, C, and D, * = p-value <0.05. Statistical values are given by ANOVA with Tukey’s post-test, n = 5–7 for all groups at all time-points.
