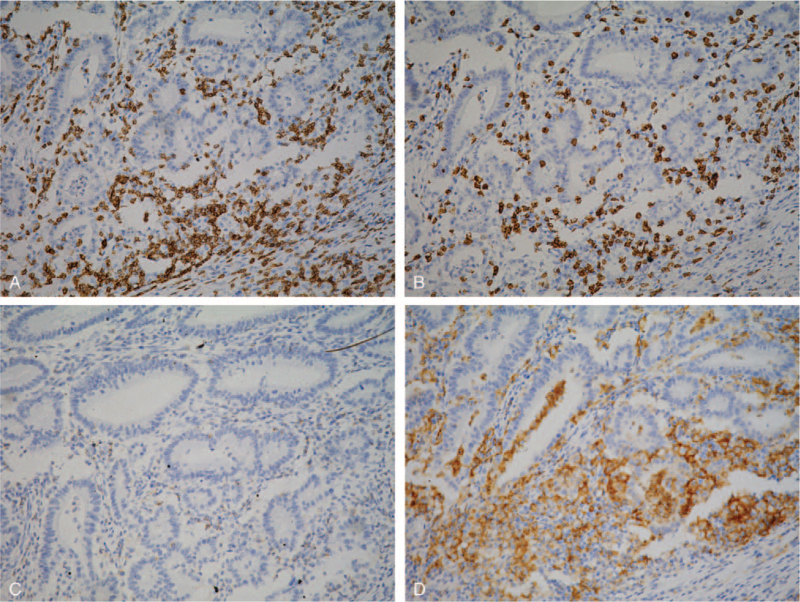
Figure 1.
Representative examples of immunostaining of various markers of positive (brown) immune cells in CRC tissue microarrays. CD3 (A), CD8 (B), PD-1 (C), and PD-L1 (D) immune cells are shown. Negative immune cells are indicated by blue immunostaining. Digital images were analyzed using the image software, and the densities of positive immune cells (CD3, CD8, CD45RO, PD-1, and PD-L1 cells) were recorded as the number of positive cells per 1 mm2 of tissue surface area. CRC = colorectal cancer, PD-1 = programmed death protein-1, PD-L1 = programmed cell death protein ligand-1.

