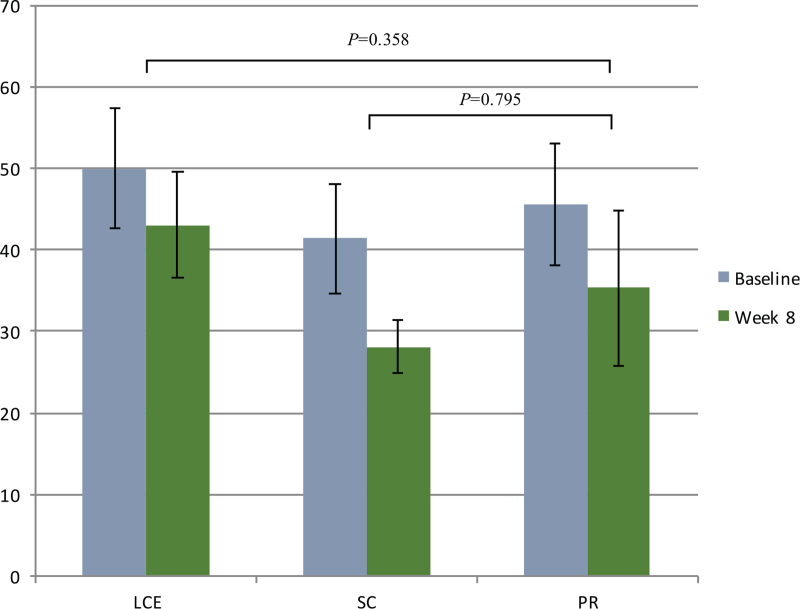
Figure 6.
Results for SGRQ from baseline to 8-weeks. Data are presented as mean values with error bars representing standard errors (95% CI). CI = confidence interval, LCE = lung-conduction exercise group, PR = pulmonary rehabilitation group, SC = standard care group, SGRO = St. George Respiratory Questionnaire.

