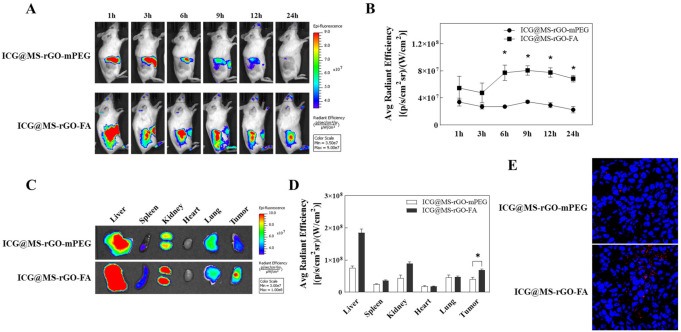
Figure 6.
In vivo biodistribution imaging of ICG@MS-rGO-mPEG and ICG@MS-rGO-FA nanocomposites in CT-26 tumor-bearing mice. (A) Representative in vivo fluorescence imaging after i.v. injection at different times (1 h, 3 h, 6 h, 9 h, 12 h, and 24 h). (B) Fluorescence intensity of CT-26 tumor tissues (n = 4, * p < 0.05). (C) Representative ex vivo fluorescence imaging of major organs at 24 h post-injection. (D) Fluorescence intensity of major organs (n = 4, * p < 0.05). (E) Fluorescence microscopy imaging of tumor tissues.

