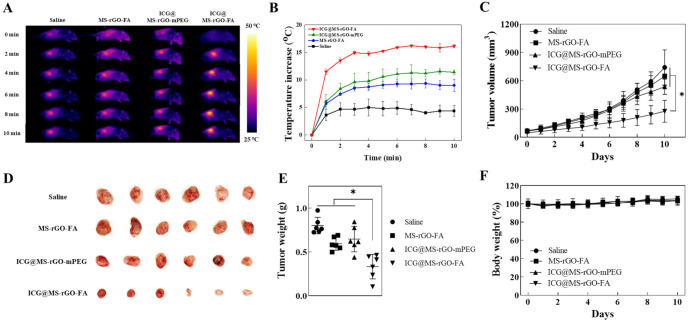
Figure 7.
In vivo anticancer therapy. (A) IR thermal images of CT-26 tumor-bearing mice that received different treatments. (B) Temperature curves of tumors in mice of different. (C) Tumor growth curve with different treatments. (D) Photograph showing the tumor from mice with various treatments. (E) Tumor weight from each group of the mice. (F) Body weight of mice in the various administrations. * p < 0.05.

