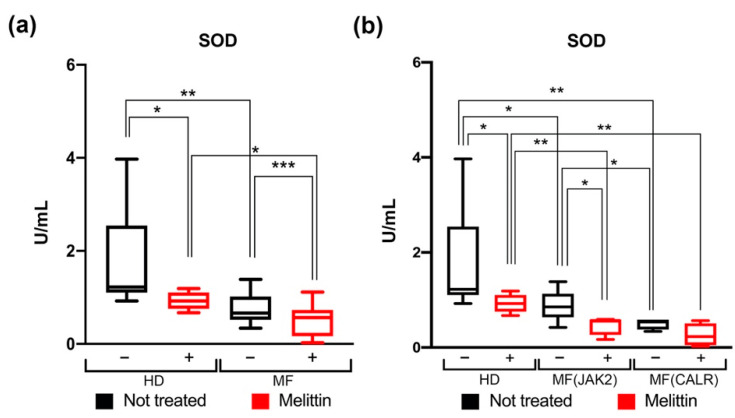
Figure 2.
Measurement of SOD activity in CD34+ cells of MF patients. (a) Box plot shows the SOD activity in HD and in MF Scheme 24. hours Melittin treatment respectively. (b) Box plot shows the percentages of SOD activity in the comparison between JAK2 or CALR-mutated MF patients compared to HD, with (red bars) or without (black bars) 24 h Melittin treatment respectively. SOD activity was normalized based on total amount protein were used to perform the assay. Data are reported as median of SOD activity (expressed in U/mL) with 95% CI (confidence interval). The comparisons between HD and MF were performed using Mann–Whitney U test, while the comparisons between treated and not treated cells were analyzed using Wilcoxon matched-pairs signed rank test. * p < 0.05, ** p < 0.01, *** p < 0.001.

