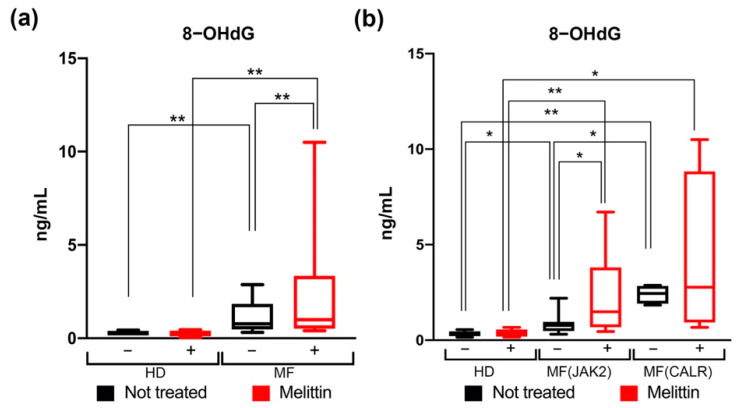
Figure 3.
Measurement of 8-OHdG levels in CD34+ cells of MF patients. (a) Box plot shows the 8-OHdG levels in HD and in MF samples, with (red bars) or without (black bars) 24 h Melittin treatment respectively. (b) Box plot shows the levels of 8-OHdG in JAK2- or CALR-mutated MF patients compared to HD, with (red bars) or without (black bars) 24 h of Melittin treatment respectively. Data are reported as median of 8-OHdG levels (expressed in ng/mL) with 95% CI (confidence interval). The comparisons between HD and MF were analyzed by means of Mann–Whitney U test, while the comparisons between treated and not treated cells were analyzed using Wilcoxon matched-pairs signed rank test. * p < 0.05, ** p < 0.01.

