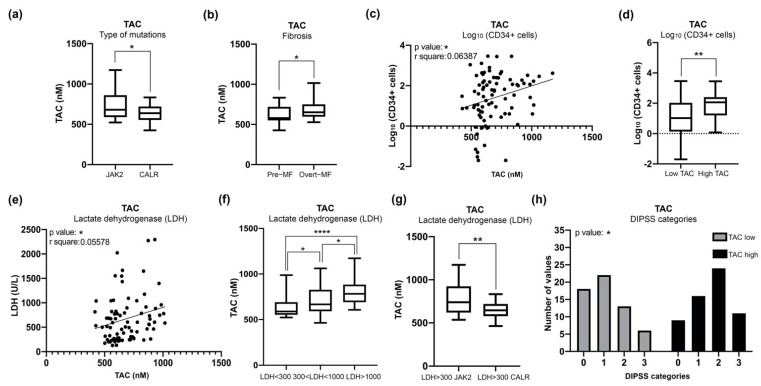
Figure 4.
Measurement of TAC in plasma of MF patients and correlation with clinical detrimental features. (a) Box plot shows the level of TAC in CALR and JAK2-mutated MF patients. (b) Box plot shows correlation analysis of TAC level with fibrosis. (c) Graph represents linear regression analysis in MF patients showing correlation between the count of circulating CD34+ cells and TAC levels. (d) Box plot represents correlation analysis of the count of circulating CD34+ cells in MF samples presenting low or high levels of TAC. (e) Graph represents linear regression analysis in MF patients showing correlation between serum LDH and TAC levels. (f) Box plot represents correlation analysis of TAC levels with levels of serum LDH in MF samples divided into three ranges: LDH < 300, 300 < LDH < 1000, LDH > 1000 nM. (g) Graph showing correlations between JAK2- and CALR-mutated patients with LDH > 300 nM and TAC plasma levels. (h) Histogram was obtained from contingency tables computed to correlate low or high TAC plasma levels and DIPSS classification; the analysis was conducted with Chi-square test. Samples with low or high TAC levels are represented in gray and black, respectively. Box plot data are reported as median with 95% CI; the comparisons between two categories were analyzed with Mann–Whitney U test, while multiple comparisons were analyzed with Kruskal Wallis test. * p < 0.05, ** p < 0.01, **** p < 0.0001.

