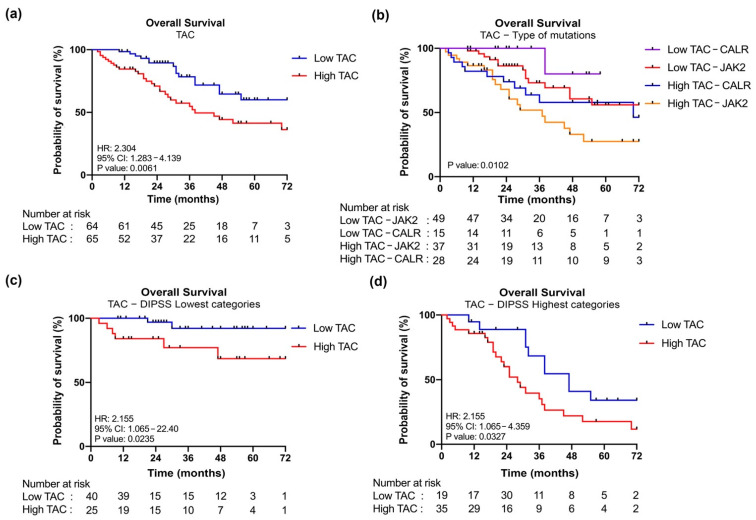
Figure 5.
Kaplan–Meier analysis of OS according to TAC plasma levels. (a) Kaplan–Meier estimates OS according to TAC plasma levels. Patients’ cohort was stratified into two groups (low and high) according to the plasma levels of TAC. Blue and red curves represent patients with low or high levels of TAC respectively. (b) Kaplan–Meier estimates of OS according to TAC plasma levels and type of mutations. For this analysis patient cohort was stratified into four groups: CALR-mutated samples with low TAC (in violet), JAK2-mutated samples with low TAC (in red), CALR-mutated samples with high TAC (in blue), JAK2-mutated samples with high TAC (in yellow). (c) Kaplan–Meier estimates of OS according to TAC plasma levels in DIPSS lowest categories (Low and Intermediated-1). (d) Kaplan–Meier estimates of OS according to TAC plasma levels in DIPSS highest categories (High and Intermediated-2). Differences between two survival curves was evaluated by log-rank (Mantel–Cox) test. HR, hazard ratio computed to determine the magnitude of differences between two curves. 95% CI, 95% confidence interval. p value was computed by log-rank test.

