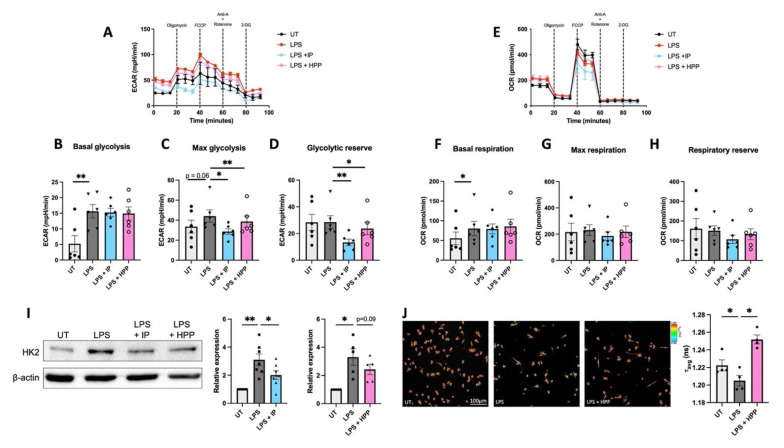
Figure 5.
HPP and IP modulate metabolic reprogramming in LPS-stimulated DC. Primary human DC were pre-treated with either HPP or IP at 1000 μM for 6 h before stimulation with LPS (100 ng/mL) for 12 h. The extracellular acidification rate (ECAR) and the oxygen consumption rate (OCR) were measured using a Seahorse XFe96 analyser before and after the injections of oligomycin (1 mM), FCCP (1 mM), antimycin A (500 nM) and rotenone (500 nM), and 2-DG (25 mM). Bioenergetic profiles from one representative experiment depicting (A) ECAR and (E) OCR measurements over time. Pooled data (N = 6) depicts the calculated mean (±SEM) of (B) basal glycolytic rate, (C) max glycolytic rate, (D) glycolytic reserve, (F) basal respiratory rate, (G) max respiratory rate, and (H) respiratory reserve for each treatment group. (I) HK2 expression was measured by western blot. Densitometry results shown are mean ± SEM of the relative expression of HK2: β-actin from five to seven healthy donors. (J) FLIM images of DC measuring intracellular NADH. Pooled data (N = 4) depicts the mean (±SEM) of the ratio of bound:free NADH, represented by the τ average. Repeated measures one-way ANOVA, with Dunnett’s multiple comparisons post hoc test, was used to determine statistical significance by comparing means of treatment groups against the mean of the control group (** p < 0.01, * p < 0.05). ImageLab (Bio-Rad) software was used to perform densitometric analysis.

