Figure 2.
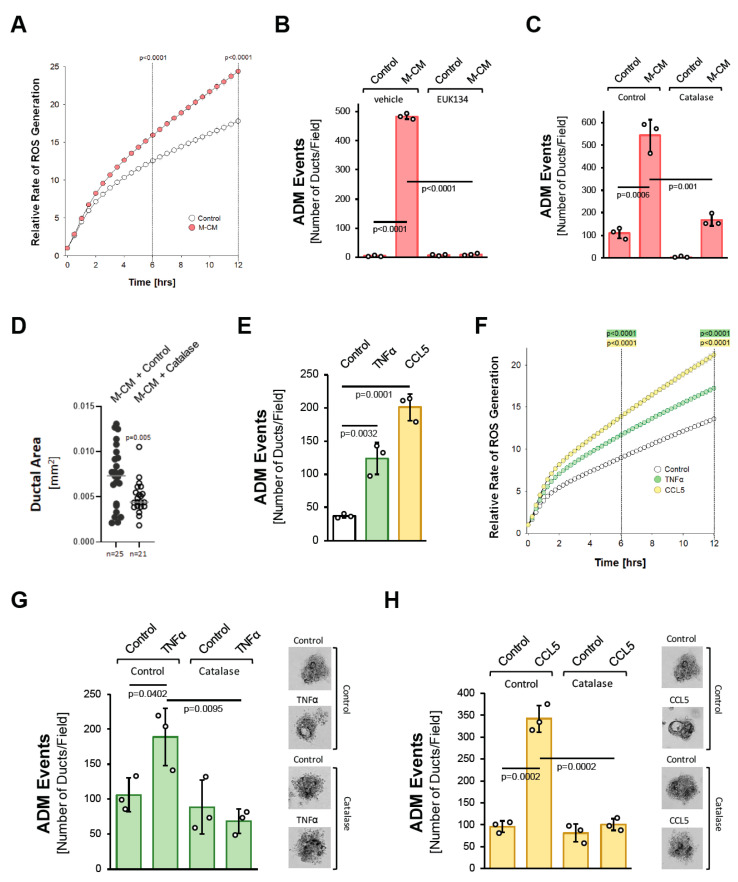
Macrophage-secreted factors induce pancreatic ADM through hydrogen peroxide. (A): Primary mouse acinar cells were stimulated as indicated and labeled with H2DFFDA. Generation of intracellular ROS (fluorescent DCF) was measured over the indicated time period. (B): Mouse pancreatic acinar cells were isolated and seeded in 3D collagen culture. As indicated, cells were treated with EUK134 (25 µM) and ADM was induced by replacing the overlaying media with macrophage media (Control) or macrophage-conditioned media (M-CM). Ducts formed were quantified as described in the Methods section. (C): Mouse pancreatic acinar cells were isolated, infected with rAD-Null or rAD-CVM-Cat and seeded in 3D collagen culture. As indicated, effects on ADM were quantified after stimulation with control media or M-CM. (D): Ducts formed after induction of ADM with M-CM following adenoviral expression of catalase (or control) were analyzed for their ductal area using ImageJ. (E): Mouse pancreatic acinar cells were isolated, seeded in 3D collagen culture and stimulated with vehicle (Control), TNFα (50 ng/mL) or CCL5 (50 ng/mL). Ducts formed were quantified as indicated in the Methods section. (F): Primary mouse acinar cells were stimulated as indicated and labeled with H2DFFDA. Generation of intracellular ROS (fluorescent DCF) was measured over the indicated time period. (G,H): Mouse pancreatic acinar cells were isolated, infected with rAD-Null or rAD-CVM-Cat and seeded in 3D collagen culture. ADM was induced with 50 ng/mL TNFα (G) or 50 ng/mL CCL5 (H) and ducts formed were quantified as indicated in the Methods section. Representative pictures are shown on the right side. (A–H): All experiments shown were performed in triplicates for at least three times and obtained similar results in each repeat. Statistical analysis between two groups was performed using the Student’s t-test. A p value of 0.05 was considered statistically significant and values are included in the graphs.

