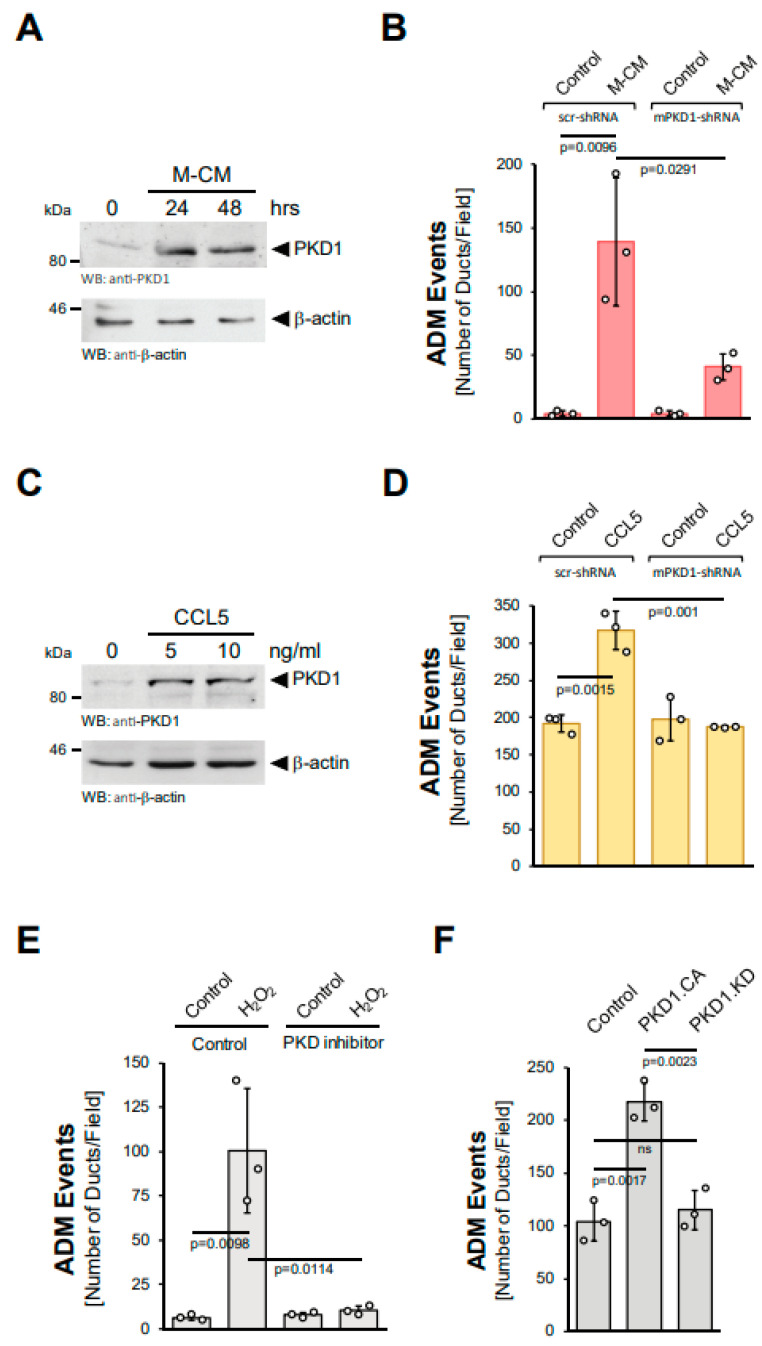
Figure 4.
Protein Kinase D1 is downstream of different inducers of ADM. (A): Mouse pancreatic acinar cells were isolated and stimulated with M-CM for the indicated time. Cells were lysed and analyzed by Western blot for expression of PKD1 or for β-actin (control for equal loading). (B): Mouse pancreatic acinar cells were isolated, lentivirally-infected with control (scr-shRNA) or mPKD1-shRNA and seeded in 3D collagen culture. As indicated, ADM was induced by replacing the overlaying media with macrophage media (control) or macrophage-conditioned media (M-CM). Ducts formed were quantified as described in the Methods section. (C): Mouse pancreatic acinar cells were isolated and stimulated with CCL5 at indicated dosages for 48 h. Cells were lysed and analyzed by Western blot for expression of PKD1 or for β-actin (control for equal loading). (D): Mouse pancreatic acinar cells were isolated, lentivirally-infected with control (scr-shRNA) or mPKD1-shRNA, seeded in 3D collagen culture and stimulated with vehicle (Control) or CCL5 (50 ng/mL). Ducts formed were quantified as indicated in the Methods section. (E): Mouse pancreatic acinar cells were isolated, seeded in 3D collagen culture, treated with vehicle (Control) or PKD inhibitor (kb-NB-142-70, 1 µM) and stimulated with vehicle (Control) or hydrogen peroxide (H2O2; 10 µM), as indicated. Ducts formed in three replicates were quantified as indicated in the Methods section. (F): Mouse pancreatic acinar cells were isolated, lentivirally-infected with either control vector, GFP-tagged PKD1.CA or PKD1.KW and seeded in 3D collagen culture. Ducts formed in three replicates were quantified as indicated in the Methods section. (A–F): All experiments shown were performed in triplicates for at least three times and obtained similar results in each replicate. Statistical analysis between two groups was performed using the Student’s t-test. A p value of 0.05 was considered statistically significant and values are included in the graphs.

