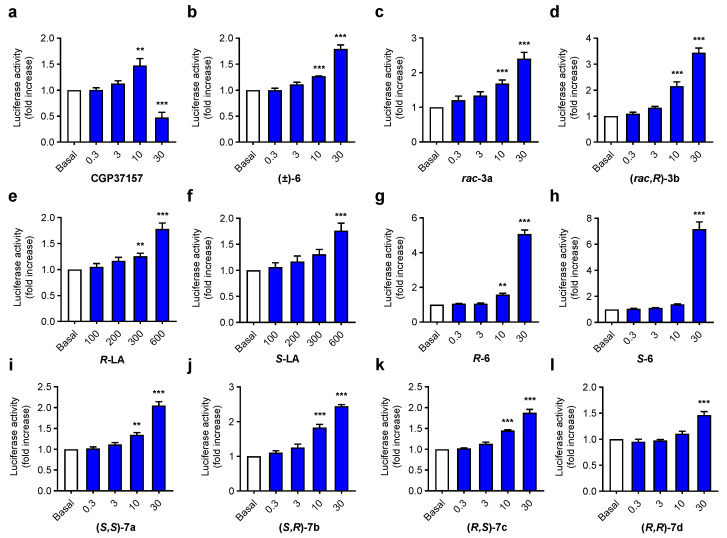
Figure 5.
NRF2 induction capacity of compounds 7a–d and their precursors 6 R- and S-LA in the AREc32 cell line. (a–l) graph bar representation of NRF2 induction capacity of compounds 7a–d, 6, LA, 3a-b and CGP37157, measured as luciferase expression in AREc32 cells and referenced to basal conditions AREc32 cells were treated with the corresponding compound at desired concentrations (0.3, 3, 10 and 30 µM), (LA derivatives: 0.1, 0.2, 0.3 and 0.6 mM) or culture medium (basal) for 24 h. Thereafter, luciferase expression was evaluated. Data are expressed as folds of increase normalized to basal conditions considered as 1. Data are means ± SEM of four independent experiments in duplicate; *** p < 0.001 and ** p < 0.01 compared to the corresponding basal conditions.

