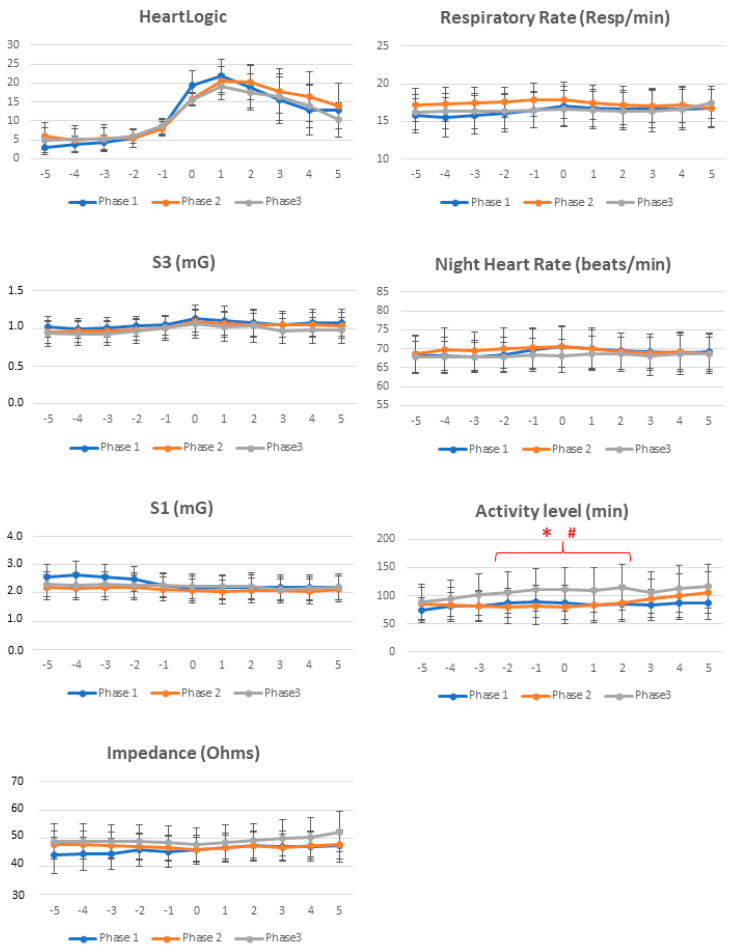
Figure 2.
Comparison of trends collected immediately before and after the alerts among study phases. Weekly averages (with standard deviation) of HeartLogic index and all physiologic parameters are reported from 5 weeks before to 5 weeks after the alert onset (week 0). S1: First heart sound; S3: Third heart sound; *: p < 0.05 post-lockdown versus pre-lockdown; #: p < 0.05 post-lockdown versus lockdown.

