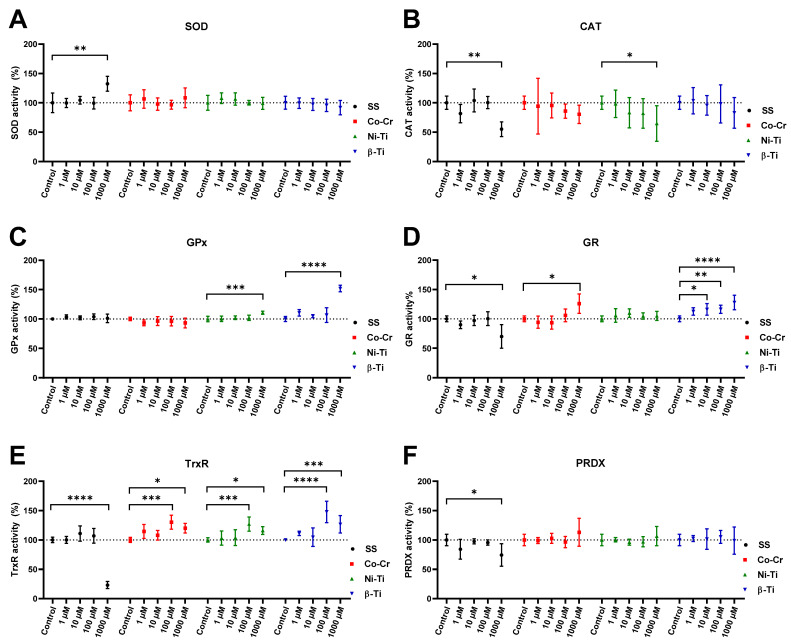
Figure 4.
Change in antioxidant enzyme activities when yeast cells are treated with increasing concentrations of different metal ion mixtures, compared to the untreated control. Graph (A) shows SOD, (B) shows CAT, (C) shows GPx, (D) shows GR, (E) shows TrxR, and (F) shows PRDX activity. The untreated sample was set at 100%, and the means with 95% confident interval are shown. Statistically different results are labeled with * (* p < 0.05, ** p < 0.01, *** p < 0.001, and **** p < 0.0001).

