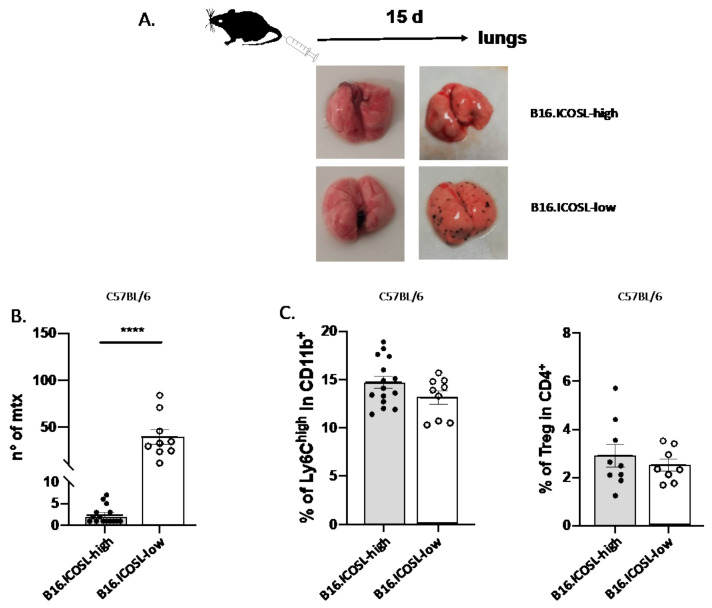
Figure 4.
Role of ICOSL expression in B16-F10 cell metastasis. (A) Schematic illustration of experimental in vivo approach (top) and representative images of metastatic lung (bottom) from B16-ICOSL-high and B16-ICOSL-low injected mice, at baseline (left) and after 15 days (right). (B) The graph shows the number of lung metastases in B16-ICOSL-high and B16-ICOSL-low C57BL/6-injected mice (n = 9–15 mice). Data are shown as means ± SEM. The Mann–Whitney statistical test was used, **** p < 0.0001 (C) Left: bar graph showing the percentage of M-MDSC among total CD11b+ cells in the lung of C57BL/6 mice injected with B16-ICOSL-high and B16-ICOSL-low cells. Right: bar graph showing the percentage of Treg among total CD4+ cells in the lung of C57BL/6 mice injected with B16-ICOSL-high and B16-ICOSL-low cells.

