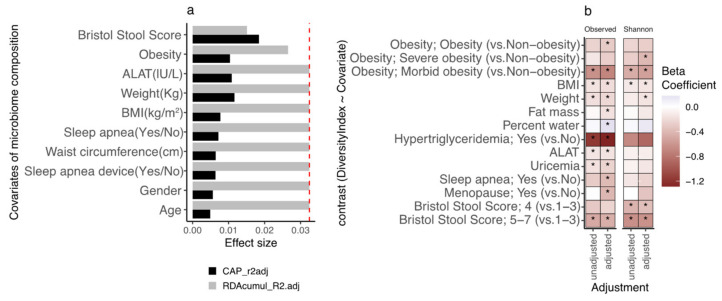
Figure 1.
Links between clinical covariates, microbiome composition, and microbiome diversity on the GutInside baseline cohort (n = 263). (a) Variables explaining the microbiome compositional variation (distance-based redundancy analyzes, dbRDA; genus-level Bray–Curtis dissimilarity), either independently (univariate effect sizes in black; features with p-value < 0.05 in dbRDA) or in a multivariate model (cumulative effect sizes in grey). The cut-off for significant non-redundant contribution to the multivariate model is represented by the red line (p-value < 0.05 in stepwise model building). (b) Heatmap of beta-coefficients product of linear regression of species richness and Shannon evenness (dependent variable) vs. clinical covariates (dependent variable; y-axis) under unadjusted and adjusted design by age, gender, and center of recruitment (x-axis). Only significant contrasts are included in the figure (* = p-value < 0.05; Obesity: 4-level variable based on BMI ranges < 30 (non-obesity), 30 ≤ BMI < 35 (obesity); 35 ≤ BMI < 40 (severe obesity); BMI ≥ 40 (Morbid obesity)).

