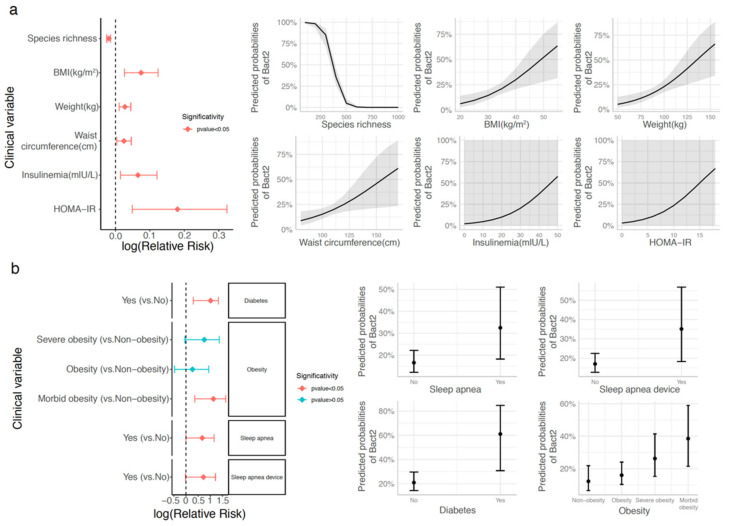
Figure 2.
Association between Bact2 enterotype and clinical covariates in the GutInside baseline cohort (n = 263). Clinical covariates with significant association with Bact2 status over baseline cohort based on logistic regression analyses adjusted by age, gender, and center of recruitment. Results are represented as relative risk score intervals of Bact2 status (left side plots) for numerical (a) and categorical variables (b) with significant associations (p-value < 0.05). Panels on the right represent the predicted probability of Bact2 status based on logistic regression models of each clinical covariate in relative risk score panels (p-value < 0.05; adjusted by age, gender, and center of recruitment; Obesity = 30 ≤ BMI < 35; Severe obesity = 35 ≤ BMI < 40; Morbid Obesity = BMI ≥ 40; non-obesity = BMI < 30).

