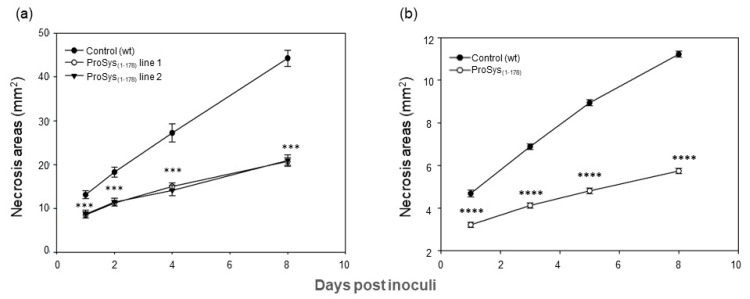
Figure 4.
Enhanced resistance of ProSys(1-178) transgenic lines and in ProSys(1-178)-treated tomato leaves to B. cinerea. (a) Dimension of necrosis areas in leaves of control plants and of ProSys(1-178) transgenic lines 1 and 2. (b) Response to B. cinerea infection in leaves from mock-treated and ProSys(1-178) treated plants. The graphs display the average (±S.E.) of the lesion size at several days post inoculum (hpi). Statistical analysis was performed by Student’s t-test (*** p < 0.001; **** p < 0.0001). Asterisks denote mean values that are significantly different.

