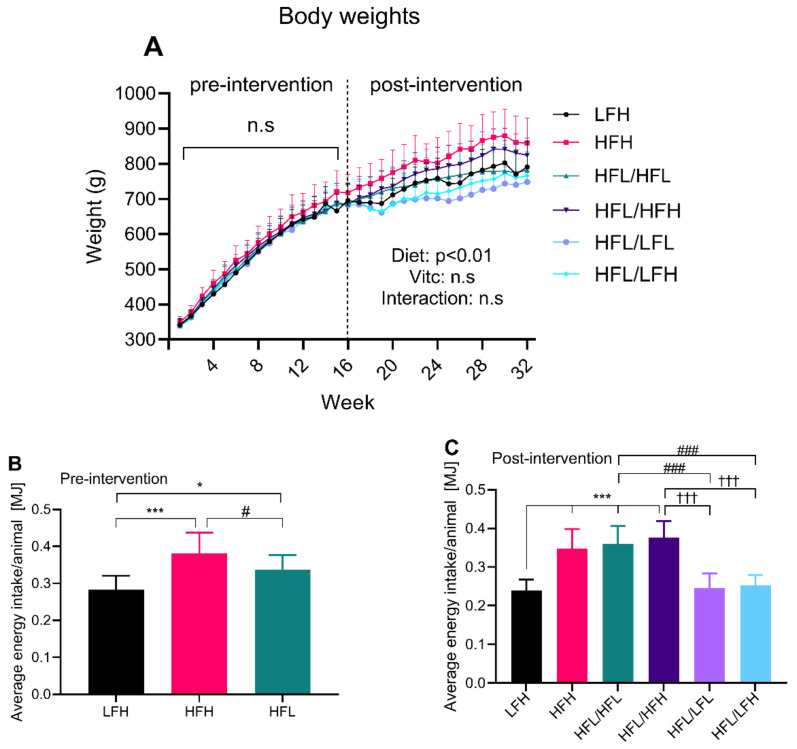
Figure 2.
Body weights and energy intake. (A) Body weights presented as means ±SD; error bars are shown as one-sided on the graph. There were no differences in body weight in the pre-intervention period. For the post-intervention period, weights were analyzed by repeated measures three-way ANOVA, overall effects of factors (diet, VitC, and diet/vitC) depicted on the graph (n = 10). (B) Average energy intake/animal/day is presented as means ± SD, and was analyzed by one-way ANOVA with a Tukey’s multiple comparisons test, n = 13 weeks. (C) Average energy intake per animal is presented as means ± SD. LFH (control) was compared to all other groups by one-way ANOVA with a Tukey’s multiple comparisons test. In a separate analysis, all intervention groups were compared by one-way ANOVA with a Tukey’s multiple comparisons test, n = 13 weeks. Compared to LFH: * p < 0.05, *** p < 0.001; compared to HFL/HFL: # p < 0.05, ### p < 0.001; and compared to HFL/HFH: ††† p < 0.01. ns: not significant. HFH: high fat high vitC, HFL: high fat low VitC, LFH: low fat high vitC, LFL: low fat low vitC, vitC: vitamin C.

