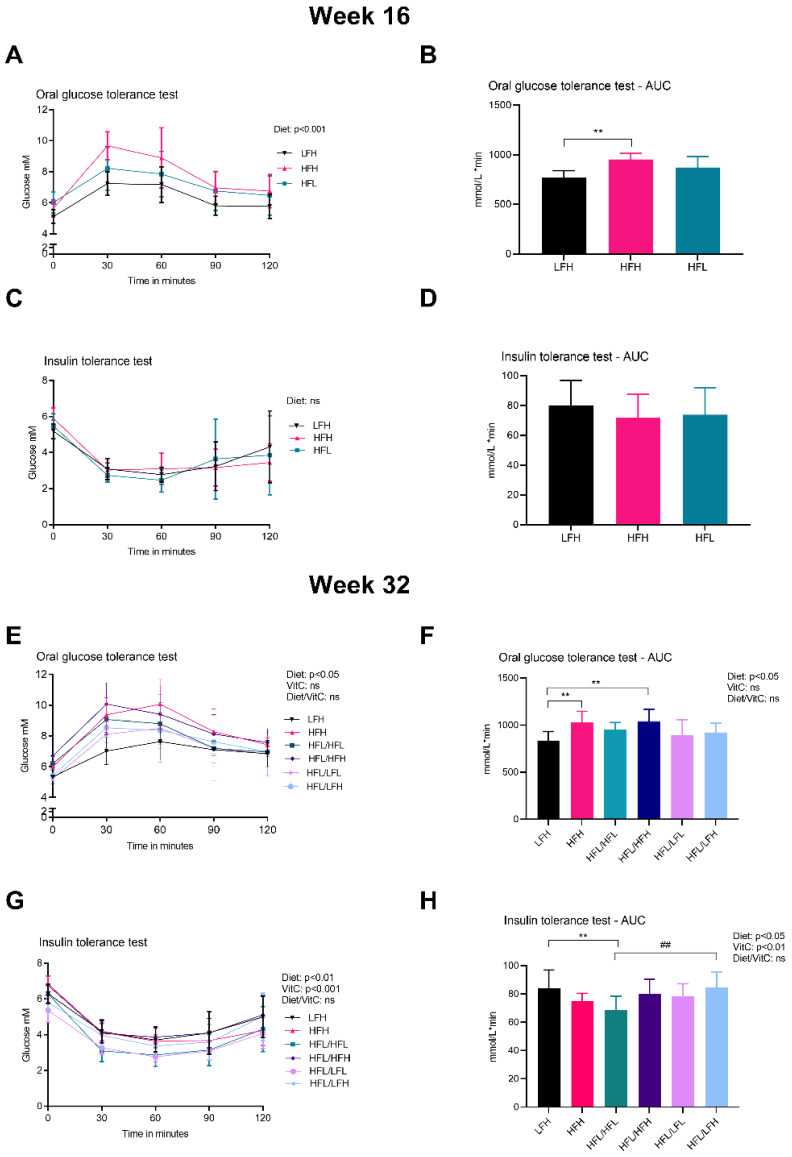
Figure 3.
Glucose homeostasis. (A) OGTT at week 16. Log transformed data were analyzed by a two-way ANOVA (only results from the overall ANOVAs are shown). (B) AUC for OGTT at week 16. Data were analyzed by a one-way ANOVA with a Tukey’s test for multiple comparisons. (C) ITT at week 16. Log transformed data were analyzed by a two-way ANOVA (the overall ANOVA was not significant). (D) AUC for ITT at week 16. Normalized data were analyzed by a one-way ANOVA. (E) OGTT at week 32. Data were analyzed by a three-way ANOVA (only results from the overall ANOVA are shown). (F) AUC for OGTT at week 32. All groups were compared to LFH by a one-way ANOVA with a Dunnett’s test for multiple comparisons. In a separate analysis, intervention groups were analyzed by a two-way ANOVA with a Tukey’s multiple comparisons test. (G) ITT at week 32. Data were analyzed by a three-way ANOVA (only results from the overall ANOVA are shown). (H) AUC for ITT at week 32. Normalized data for all groups were compared to LFH by a one-way ANOVA with a Dunnett’s test for multiple comparisons. In a separate analysis, intervention groups were analyzed by a two-way ANOVA with a Tukey’s multiple comparisons test. All data are presented as means ± SD n = 7–10. ** p < 0.01 compared to LFH; ## p < 0.01 compared to HFL/HFL. ns: not significant. AUC: area under the curve, HFH: high fat high vitC, HFL: high fat low vitC, ITT: insulin tolerance test, LFL: low fat low vitC, LFH: low fat high vitC, OGTT: oral Glucose tolerance test, vitC: vitamin C.

