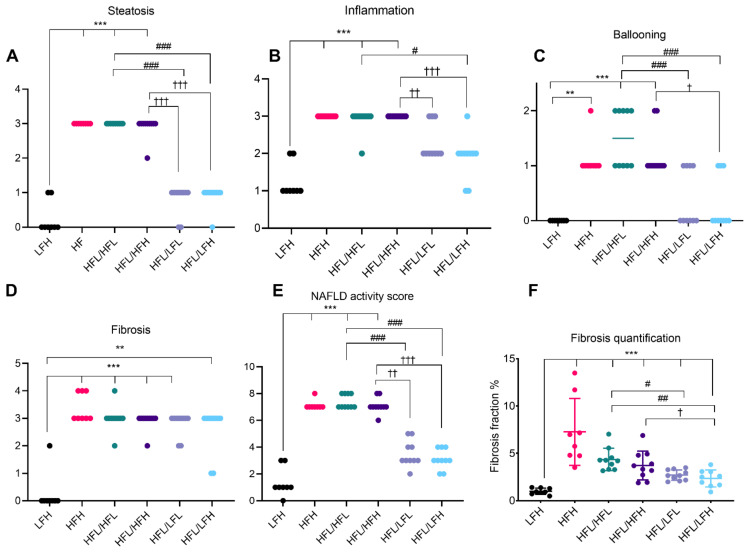
Figure 5.
Hepatic histopathological scoring and fibrosis quantification at week 32. Data are represented as individual values (scores) with medians (A–E) or means ± SD (F) (n = 8–10/group). Semi-quantitative scoring results are depicted in (A) steatosis, (B) inflammation, (C) ballooning, and (D) fibrosis. (E). Cumulative NAFLD activity score for each animal. (F). Fibrosis fraction quantified by image analyses of picrosirius red stained sections and displayed as % of total tissue (section) area. Scoring was analyzed by a non-parametric Kruskal–Wallis with a Dunn’s multiple comparisons test, comparing all groups to LFH or to post-intervention groups in a separate analysis. For fibrosis quantification, LFH vs. all groups was analyzed by one-way ANOVA with Dunnett’s multiple comparisons test on log transformed data and, for intervention groups, data were analyzed by a two-way ANOVA with a Tukey’s test for multiple comparisons. Difference from LFH. ** p < 0.01, *** p < 0.001. Difference from HFL/HFL: # p < 0.05; ## p < 0.01; ### p < 0.001. Difference from HFL/HFH: † p < 0.05; †† p < 0.01; ††† p < 0.001. HFH: high fat high vitC, HFL: high fat low vitC, LFL: low fat low vitC, LFH: low fat high vitC, VitC: vitamin C.

